All the solutions provided in McGraw Hill My Math Grade 3 Answer Key PDF Chapter 12 Lesson 4 Relate Bar Graphs to Scaled Picture Graphs will give you a clear idea of the concepts.
McGraw-Hill My Math Grade 3 Answer Key Chapter 12 Lesson 4 Relate Bar Graphs to Scaled Picture Graphs
Math in My World
Example 1
Ishi counted the number of each type of fish in her fish tank. The scaled picture graph displays the data. Write a few sentences that interpret the data. Then answer the questions.
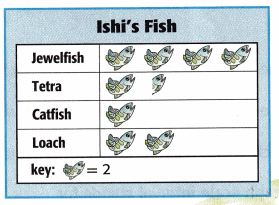
There are ____________ jewelfish.
The number of catfish is ______________.
Ishi has ______________ tetras and ______________ loaches.
Altogether, Ishi has ______________ fish.
What kind of fish does Ishi have the fewest of?
Ishi has twice as many ______________ as loaches.
Are there more or less jewelfish than catfish, tetras, and loaches combined? Explain.
Answer:
There are 8 jewelfish.
The number of catfish is 2.
Ishi has 3 tetras and 4 loaches.
Altogether, Ishi has 17 fish.
Ishi has the fewest fish tetra.
Ishi has twice as many catfish as loaches.
Therefore jewelfish is less than catfish, tetra and loches together.
Example 2
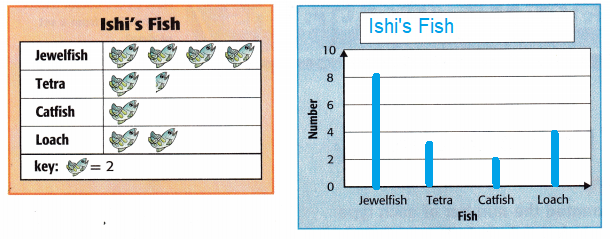
Does the data change from when it is displayed in a scaled picture graph to when it is displayed in a bar graph?
Use the data from the scaled picture graph to complete the bar graph.
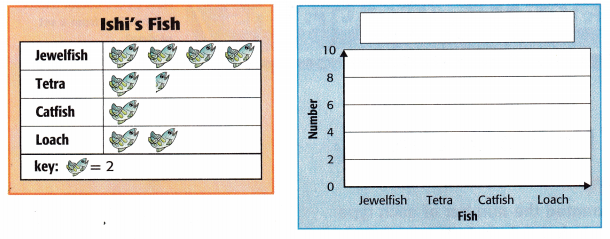
The scaled picture graph represents the data with ______________.
The bar graph represents the data with ______________.
Each scaled picture graph symbol stands for ______________ fish. Each bar graph scale interval stands for ______________ fish.
So, the data does ______________ change when it is displayed in a scaled bar graph.
Answer:
The scaled picture graph represents the data with fishes.
The bar graph represents the data with fish.
Each scaled picture graph symbol stands for Ishi’s fish. Each bar graph scale interval stands for Ishi’s fish.
So, the data does not change when it is displayed in a scaled bar graph.
Talk Math
If the scale for the bar graph above was in intervals of 4, would the information be different? Explain.

Answer:
On the scale for the bar graph if the interval is changed to 4 in the above example also there is no change in the information.
Guided Practice
Question 1.
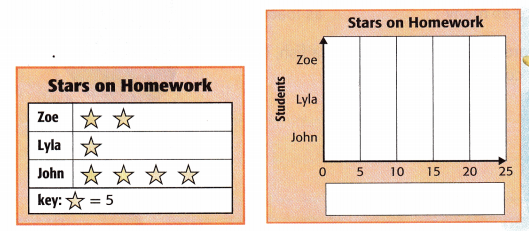
Complete the bar graph using the data from the scaled picture graph.
Answer:
Given that,
Stars for the Zoe is 10.
Stars for the Lyla is 5.
Stars for the John is 20.
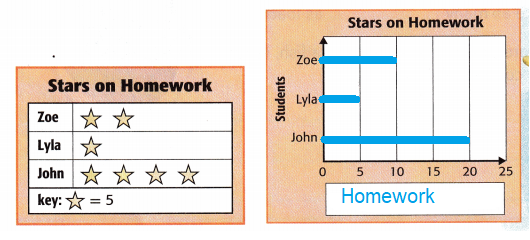
The data is shown in the bar graph.
Independent Practice
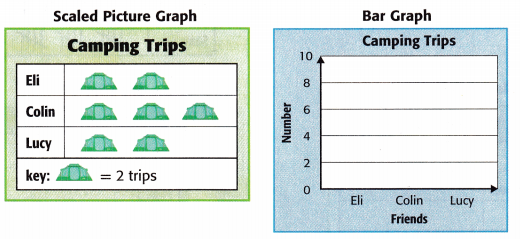
Use the data from the first graph to display in the second graph. Write one sentence about the data in the graphs.
Question 2.
Answer:
Given that,
The total number of Eli trips is 4.
The total number of Colin trips is 6.
The total number of Lucy trips is 4.
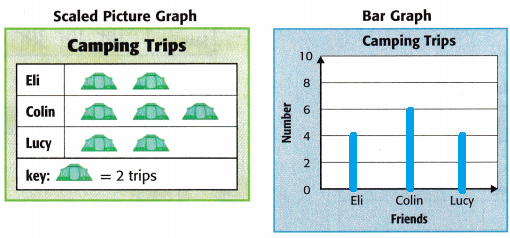
The trip data is shown in the bar graph.
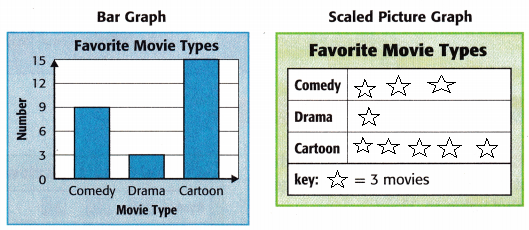
Question 3.
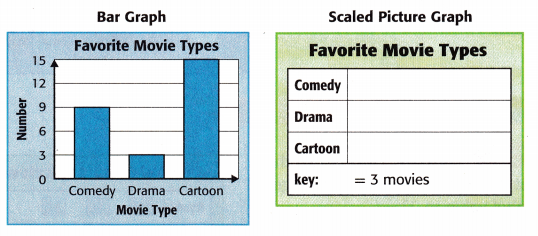
Answer:
Given that,
The total number of comedy movies is 9.
The total number of Drama movies is 3.
The total number of Cartoon movies is 15.
From the data draw the bar graph.
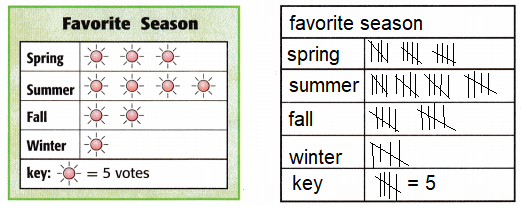
Question 4.
Complete the tally chart that may have been used to create this scaled picture graph.
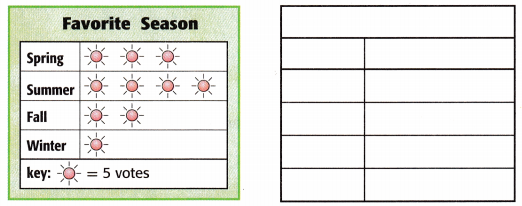
Answer:
Given that,
The total number of votes for the Spring season is 15.
The total number of votes for the Summer season is 20
The total number of votes for the fall season is 10.
The total number of votes for the Winter season is 5.
Problem Solving
Question 5.
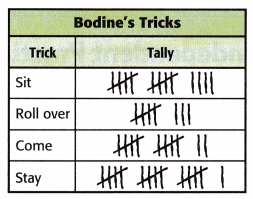
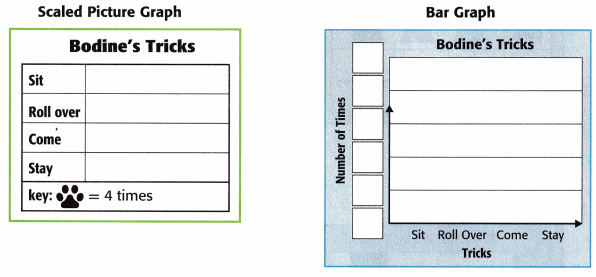
Ella kept a tally chart of all the times her dog did a trick. Display the data in a scaled picture graph and a bar graph.
Answer:
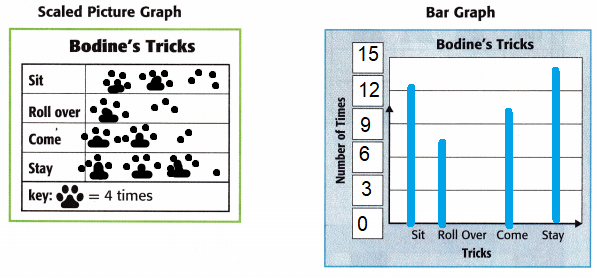
Given that,
The number of sit tricks is 12.
The number of Rollover tricks is 7.
The number of come is tricks is 10.
The number of stay tricks is 13.
Draw the bar graph using the data.
HOT Problems
Question 6.
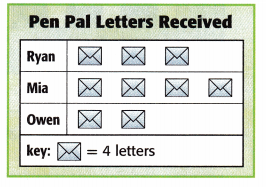
Mathematical PRACTICE Reason How would the graph at the right change if you changed the symbol value to 2?
Answer:
If you change the value of 4 to 2 then you can change the graph.
After changing the value 4 to 2 then you have the data is,
The total number of letters that Ryan received is 2 + 2 + 2 = 6.
The total number of letters that Mia received is 2 + 2 + 2 + 2 = 8.
The total number of letters that Owen received is 2 + 2 = 4.
Question 7.
What might the scale for a bar graph that displays the same data with the symbol value of 4 be?
________, _________, ________, _________, ___________
Answer:
The bar graph displays the same data with the symbol value of 4. the values of the given data are
The total number of letters that Ryan received is 4 + 4 + 4 = 12.
The total number of letters that Mia received is 4 + 4 + 4 + 4 = 16.
The total number of letters that Owen received is 4 + 4 = 8.
Question 8.
Building on the Essential Question Why are graphs helpful?
Answer:
The purpose of the graph is used to present the data that are too numerous and the graphs are the virtual representation of data.
McGraw Hill My Math Grade 3 Chapter 12 Lesson 4 My Homework Answer Key
Practice
Question 1.
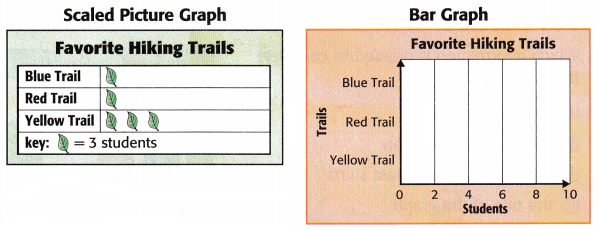
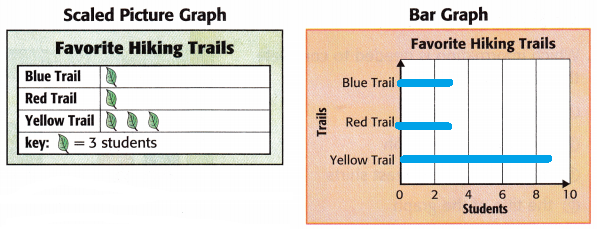
Complete the bar graph using the data from the scaled picture graph. Write one sentence about the data in the graphs.
Answer:
Given that,
The total number of students in the Blue Trail is 3.
The total number of students in the Red Tail is 3.
The total number of students on the yellow Trail is 9.
From the data, we draw the bar graph.
Question 2.
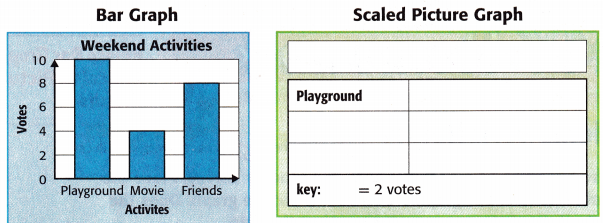
Complete the scaled picture graph using the data from the bar graph. Write one sentence about the data in the graphs.
Answer:
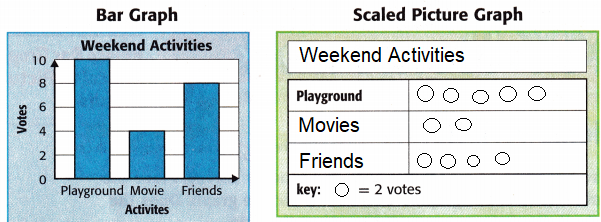
Here 1 circle = 2 votes.
The total number of votes for playground = 10.
The total number of votes for movies = 4.
The total number of friends = 8.
Problem Solving
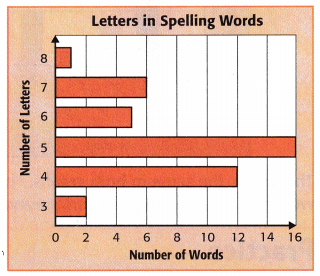
The bar graph shows the number of letters in the third grade spelling words. Refer to the bar graph for Exercises 3-4.
Question 3.
How many letters do most of the spelling words have?
Answer:
The total number of words is 6.
The total number of spelling words is 2 + 12 + 16 + 5 + 6 + 1 = 42.
Therefore the total number of words is 42.
For 42 words there are 6 letters.
Question 4.
Mathematical PRACTICE Make a Plan What might the key for a scaled picture graph that displays the same data be?
Answer:
When you read the data from the pictured graph you need to know the value of each symbol and multiply each symbol by the value.
Test Practice
Question 5.
Which information is needed to complete the bar graph?
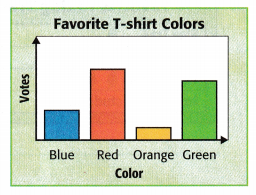
(A) the colors of shirts
(B) the scale of the graph
(C) the color with the least shirts
(D) the title of the graph
Answer:
The scale of graph information is needed to complete the graph.
Option B is the correct answer.