All the solutions provided in McGraw Hill My Math Grade 3 Answer Key PDF Chapter 12 Lesson 5 Draw and Analyze Line Plots will give you a clear idea of the concepts.
McGraw-Hill My Math Grade 3 Answer Key Chapter 12 Lesson 5 Draw and Analyze Line Plots
A line plot uses Xs above a number line to show how often a data value occurs.
Math in My World
Example 1
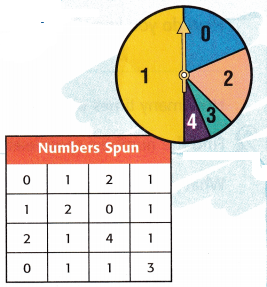
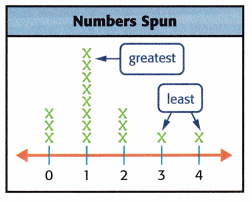
Albert spun a spinner 16 times to see how often the spinner landed on each number. Display the data in a line plot.
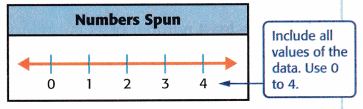
1. Draw and label a line plot. Include all values of the data. Give it a title.
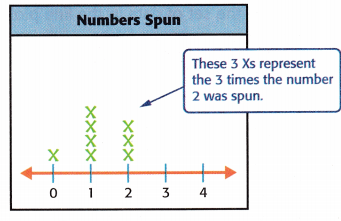
2. Draw an X above the number for each result. Complete the line plot by drawing the remaining Xs.
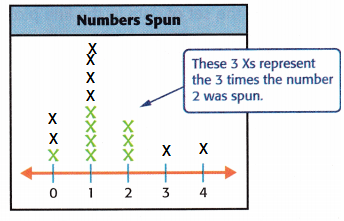
Analyze the line plot. Write a sentence that interprets the data.
Answer:
The 1 X’s represents the 4 times the number 0 was spun.
The 8 X’s represents the 8 times the number 1 was spun.
The 3 X’s represents the 3 times the number 2 was spun.
The 1 X’s represents the 1 times the number 3 was spun.
The 1 X’s re[presents the 1 times the number 4 was spun.
Example 2
Use Albert’s line plot to find the difference between the greatest number of Xs and the least number of Xs.
1. Find the number spun most often.
The number spun most often was ____________.
How do you know? ____________
How many times was the number 1 spun? ____________
2. Find the numbers spun least often.
What numbers were spun least often? ____________
How many times were each of these numbers spun? ____________
3. The difference between the greatest number of Xs
and the least number of Xs is ____________ – 1 = ____________.
Answer:
1. The number spun most often was 1.
Because the number of X’s are more in the 1.
For the 8 times the number 1 spun.
2. The two numbers are the least often.
The least often numbers are 3 and 4.
For 1 time the each of the numbers are spun.
3. The difference between the greatest of X’s and the least number of X’s is 8 – 1 = 7.
Talk Math
Does a tally chart or a line plot make it easier to see how often numbers occur in a set of data? Explain.

Answer:
Tally chart is one of the method of collecting data using tally marks. In this the data can be displayed by visual.
The advantage of the Tally chart is the data is collected quickly and efficiently.
Guided Practice
Question 1.
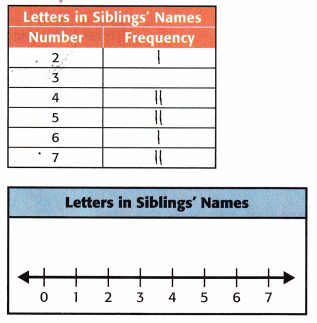
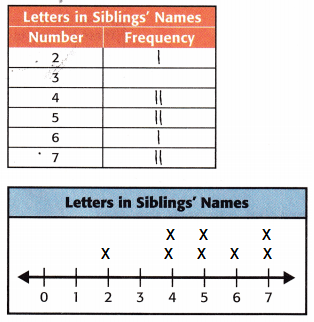
Display the set of data in the line plot.
Answer:
Given that,
The frequency of letters 2 is 1.
The frequency of letters 3 is 0.
The frequency of letters 4 is 2.
The frequency of letters 5 is 2.
The frequency of letters 6 is 1.
The frequency of letters 7 is 2.
Therefore the data is displayed on the line plot.
Independent Practice
Question 2.
Display the set of data in the line plot.
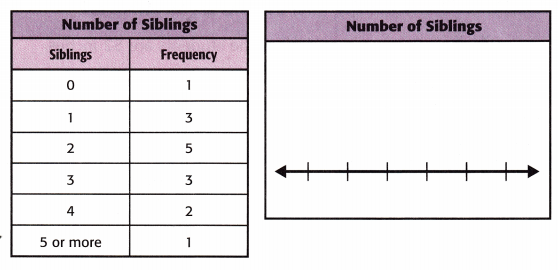
What is one conclusion you can draw from this line plot?
Answer:
The given data is displayed on the line plot.
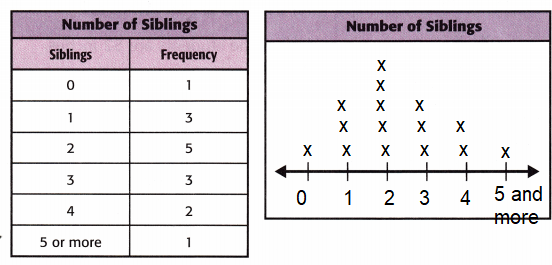
Here the height frequency is the 2 siblings.
The lowest frequency is the 0 and 5 and more siblings.
For Exercises 3 and 4, refer to the line plot below.
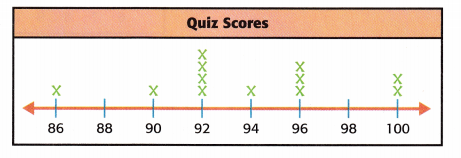
Question 3.
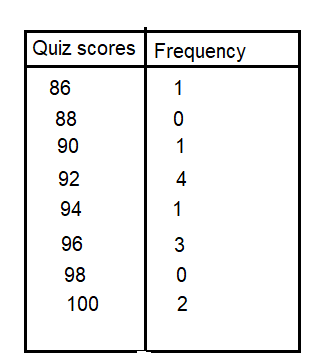
How many students’ quiz scores are recorded? Explain.
Answer:
Given that,
The Score of 1 student is 86.
The score of 1 student is 90.
The score of 4 students is 92.
The score of 1 student is 94.
The score of 3 students is 96.
The score of 2 students is 100.
Therefore the total number of students that the quiz score recorded is 1 + 1 + 4 + 1 + 3 + 2 = 12.
Question 4.
Mathematical PRACTICE Draw a Conclusion What is one conclusion you can draw from this line plot?
Answer:
The conclusion you can draw from this line plot is
Problem Solving
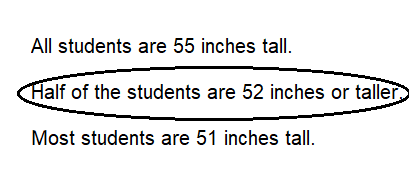
Circle the true sentence about each set of data.
Question 5.
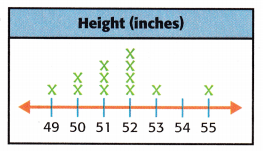
All students are 55 inches tall.
Half of the students are 52 inches or taller.
Most students are 51 inches tall.
Answer:
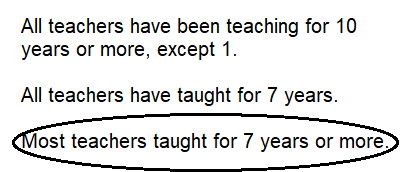
Question 6.
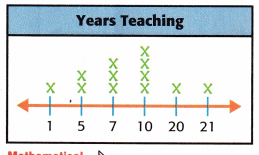
All teachers have been teaching for 10 years or more, except 1.
All teachers have taught for 7 years.
Most teachers taught for 7 years or more.
Answer:
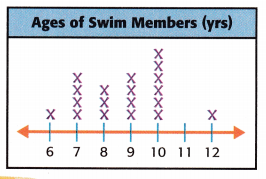
Question 7.
Mathematical PRACTICE Use Symbols Compare the number of members who are 6 years old and the number who are 8 years old. Use >, <, or =.
Answer:
Given that,
The total number of 6 years old members are 1.
The total number of 8 years old members are 3.
Therefore 1 < 3.
So, 6 years old members less than 8 years old members.
HOT Problems
Question 8.
Mathematical PRACTICE Justify Conclusions Give an example of a set of data that would not be best displayed in a line plot. Explain.
Answer:
Question 9.
Building on the Essential Question How can I interpret the data I have collected?
Answer:
There are 4 steps for the data interpret.
They are assemble the information, develop findings, develop conclusions and develop reconditions.
McGraw Hill My Math Grade 3 Chapter 12 Lesson 5 My Homework Answer Key
Practice
Use the line plot above to answer Exercises 1-3.
Question 1.
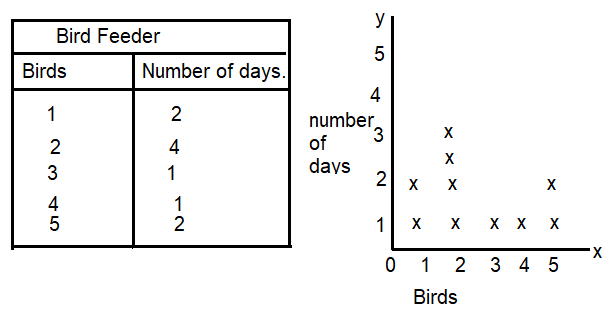
How many days were there 2 birds at the bird feeder?
Answer:
Given that,
The number of days the 1 bird at the feeder is 2.
The number of days the 2 bird at the feeder is 4.
The number of days the 3 bird at the feeder is 1.
The number of days the 4 bird at the feeder is 1.
The number of days the 5 bird at the feeder is 2.
Therefore, There are 4 days the 2 birds are at the bird feeder.
Question 2.
How many days were there 3 or fewer birds at the feeder?
Answer:
Given that,
The number of days the 1 bird at the feeder is 2.
The number of days the 2 bird at the feeder is 4.
The number of days the 3 bird at the feeder is 1.
The number of days the 4 bird at the feeder is 1.
The number of days the 5 bird at the feeder is 2.
Therefore, There are 7 days the 3 and fewer birds at the feeder.
Question 3.
How many days were there 3 or more birds at the feeder?
Answer:
Given that,
The number of days the 1 bird at the feeder is 2.
The number of days the 2 bird at the feeder is 4.
The number of days the 3 bird at the feeder is 1.
The number of days the 4 bird at the feeder is 1.
The number of days the 5 bird at the feeder is 2.
Therefore, There are 4 days the 3 or more birds at the feeder.
For Exercises 4 and 5, refer to the line plot that shows the number of states each student has visited.
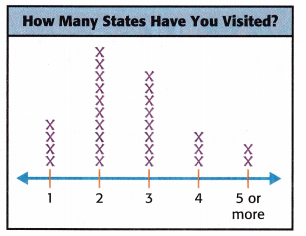
Question 4.
How many states have the most number of students visited?
Answer:
The most number of the students visited the 2 states.
Question 5.
How many students have visited three states?
Answer:
The number of students visited the three states is 8.
Problem Solving
Question 6.
Mathematical PRACTICE Model Math Mrs. Sebring’s class made a tally chart of the number of hours they spent on homework last week. Display the set of data in the line plot.
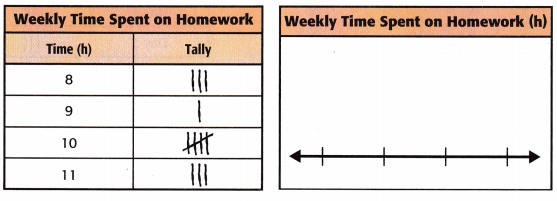
Answer:
The given data is displayed on the line plot.
Vocabulary Check
Question 7.
What is a line plot?
Answer:
The line plot can be defined has a graph that displays the data in points or cross marks above the number line.
Test Practice
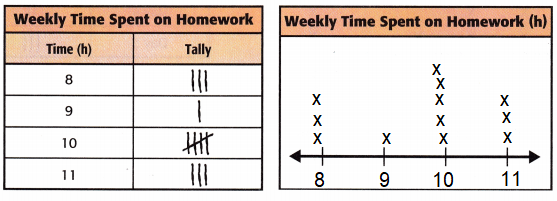
Question 8.
Refer to the line plot in Exercise 6. What is the difference between the least number of hours spent on homework and the most number of hours spent on homework?
(A) 1 hour
(B) 3 hours
(C) 8 hours
(D) 11 hours
Answer:
Given that,
The least number of hours spent on home work is 9.
The most number of hours spent on home work is 10.
The difference between the least number of hours spent on homework and the most number of hours spent on homework.
Option A is the correct answer.