All the solutions provided in McGraw Hill My Math Grade 2 Answer Key PDF Chapter 9 Lesson 1 Take a Survey will give you a clear idea of the concepts.
McGraw-Hill My Math Grade 2 Answer Key Chapter 9 Lesson 1 Take a Survey
Explain and Explain
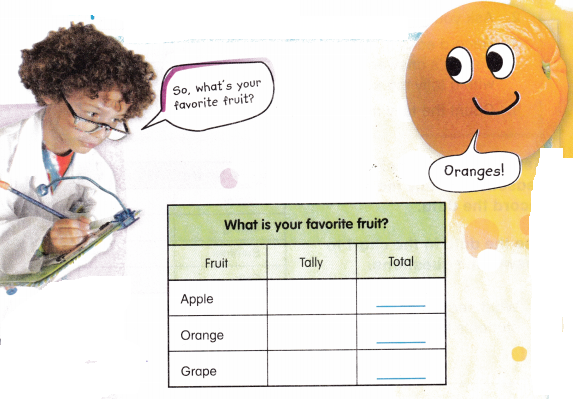
Teacher Directions: Ask 10 classmates to name their favorite fruit. Mark a tally for each choice. Write the total for each fruit. Which fruit do most people like?
Answer: The total of the each fruit is given below and Most people like Apple.
Explanation:
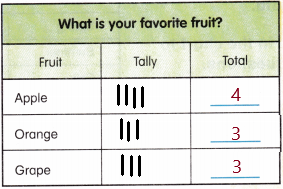
Most people like Apple.
See and Show
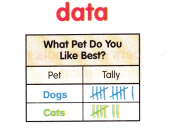
When you take a survey, you ask a question. Use tally marks to record the answers, or data. Data is information.
Taking a survey about books
- Write a question.
- Ask your question.
- Record each person’s answer with a tally mark.
- Count the tally marks.
Answer: The total marks are 15
Explanation:
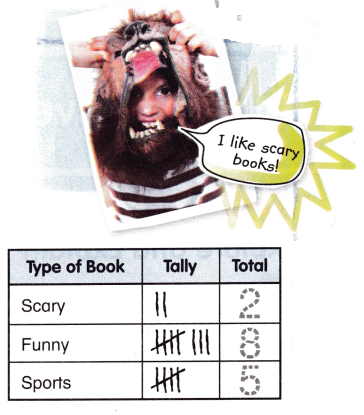
- Write a question. – Which book is like by the most of the people ?
Funny books are liked by the most of the people.
2. Ask your question. – Question the people for the survey
3. Record each person’s answer with a tally mark.- 2 People like scary books, 8 people like funny books,
5 people like Sportsbook.
4. Count the tally marks. – The total marks are 15
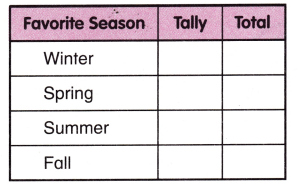
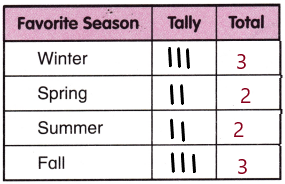
Ask 10 students their favorite season. Use tally marks to record the data. Use the data in the chart to answer the questions.
Question 1.
What season do students like best?
Answer: Winter and fall are the seasons which most of the students like best.
Explanation:
Question 2.
How many students like winter and fall? Write a number sentence to solve.
![]()
Answer: 6 students like winter and fall
Explanation:
3 students like winter season and
3 students like fall season , Then
3 + 3 = 6
So, 6 students like winter and fall .
Talk Math How do tally marks help you organize data?
Answer: Tally marks represent numbers they can count and say, but may not yet be able to write, and they are useful for keeping track of data collected by counting.
The tally marks are important as we mainly use them to keep the record of a running or continuous count. These marks are so useful for recording and maintaining the scores in a game or a sport.
Tally charts are used to collect data quickly and efficiently. Filling in a chart with marks representing numbers is faster than writing out words or figures and the data is collected into sub-groups immediately, making it easy to analyze.
On My Own
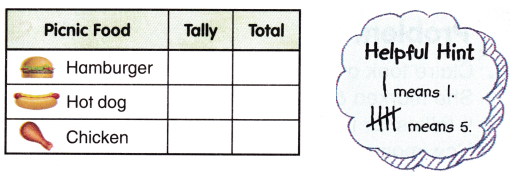
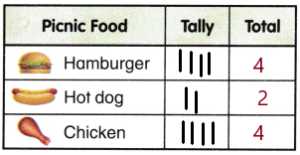
Ask 10 students their favorite picnic food. Use tally marks to record the data. Use the data in the chart to answer the questions.
Question 3.
How many students like hamburgers?
Answer: 4 students like hamburgers
Explanation:
Question 4.
How many students like hot dogs?
Answer: 2 Students like hot dogs
Explanation:
Question 5.
What is the favorite picnic food?
Answer: Both Chicken and Hamburger is the favorite picnic food
Explanation:
So, Both Chicken and Hamburger is the favorite picnic food
Question 6.
What is the least favorite picnic food?
Answer: Hot dog is the least favorite picnic food
Explanation:
Question 7.
How would the chart change if you added your favorite food?
Answer: No change because it already has my favorite food
Explanation:
Problem Solving
Question 8.
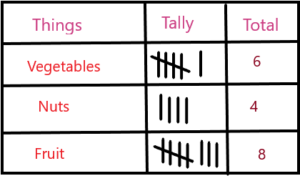
Claire took a survey of favorite snacks. She marked 6 tallies for vegetables, 4 tallies for nuts, and 8 tallies for fruit. How many friends did she survey?
____________ friends
Answer: She Surveyed the 18 Friends
Explanation:
Question 9.
Students took a survey for Fun Friday activities. Seven students want a picnic. Five students want to go to the zoo. Eight students want to watch a movie. Which chart shows these results? Circle the correct chart.
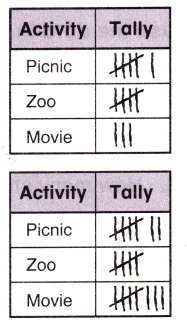
How many students were surveyed?
_____________ students
Answer: 20 Students were surveyed.
Explanation:
Given, Students took a survey for Fun Friday activities. Seven students want a picnic. Five students want to go to the zoo. Eight students want to watch a movie.
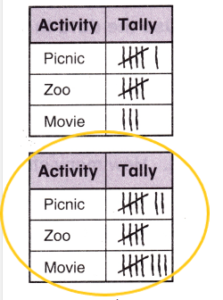
So, 20 Students were surveyed.
HOT Problem How do you record data on a tally chart?
Answer: Study the given data and make a tally chart using following steps
Explanation:
- Draw a data table with 3 columns.
- Write the category names into each row of the table.
- Record the data into the table using five-bar gate tally marks.
- Work out the frequency for each category by counting the tally marks.
McGraw Hill My Math Grade 2 Chapter 9 Lesson 1 My Homework Answer Key
Practice
Ask 10 students their favorite Exercise. Use tally marks to record the data. Use the data in the chart to answer the questions.
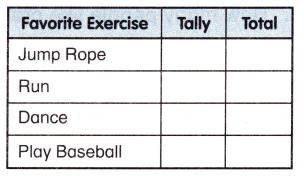
Question 1.
How many people like to run and dance?
Answer: 5 people like to run and dance
Explanation:
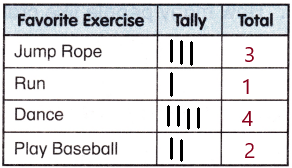
Question 2.
Do more people like to run and play baseball or dance and jump rope?
Answer: More people like to dance and jump rope ,
Explanation:

Ask 10 students their favorite snack. Use tally marks to record the data. Use the data in the chart to answer the questions.
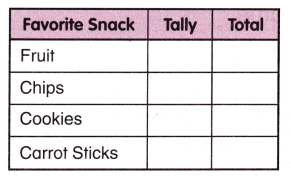
Question 3.
What snack do people like the most?
Answer: most people like Fruit
Explanation:
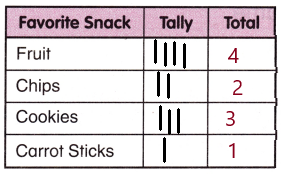
Question 4.
How many people like healthful snacks the most?
Answer: 5 People like healthful snacks the most
Explanation:
Fruit and carrot sticks are the healthful snacks most people like
Ask 10 students their favorite juice flavor. Use tally marks to record the data. Use the data in the chart to answer the questions.
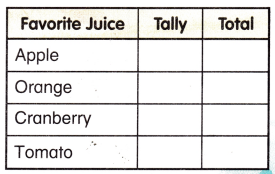
Question 5.
What juice do people like the least?
Answer: Tomato juice is the least to like by the people
Explanation:
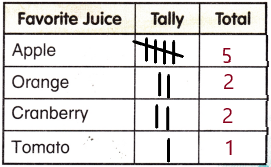
So, Tomato juice is the least to like by the people.
Question 6.
How many people like cranberry juice and apple juice in all?
Answer: 4 people like cranberry juice and apple juice in all.
Explanation:
So,4 people like cranberry juice and apple juice in all.
Vocabulary Check
Circle the word that matches the definition.
Question 7.
Numbers or symbols that show information.
tally marks
survey
data
Answer: Numbers or symbols that show information is Data
Explanation:
For example ,
So, Numbers or symbols that show information is Data
Math at Home Help your child to create a survey that they can give to family members.
Answer: An example for the survey is given below
Explanation:
for example,
We have have different items that will be sold at a school store ,
A student marked them for the survey as follows,
5 tallies for eraser, 10 for bottle of glue , 8 for pencil , 2 for Scissors
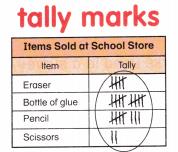
So, the student survey a total of 25 people.