All the solutions provided in McGraw Hill My Math Grade 2 Answer Key PDF Chapter 9 Lesson 2 Make Picture Graphs will give you a clear idea of the concepts.
McGraw-Hill My Math Grade 2 Answer Key Chapter 9 Lesson 2 Make Picture Graphs
Explore and Explain
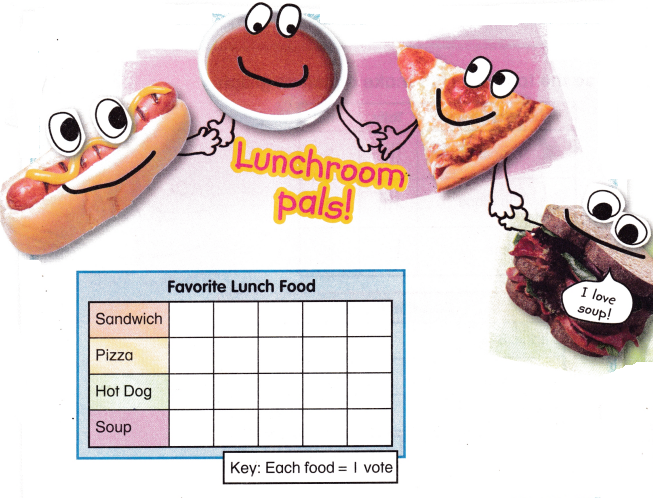
Teacher Directions: Ask five classmates to pick their favorite lunch food. Draw a picture in the chart to show each person’s choice.
Answer: Most of the classmates likes Pizza.
Explanation:
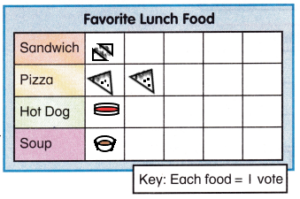
Here, sandwich got 1 vote
Pizza got 2 votes
Hot dog got 1 vote
Soup got 1 vote
So, Most of the classmates likes Pizza.
See and Show
You show data with a picture graph. The pictures are a symbol for the data.
Helpful Hint
The key tells how many each symbol stands for.
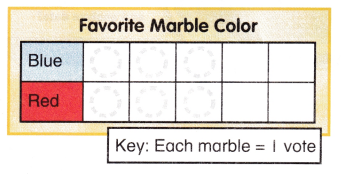
Answer: In the survey of 6 people all of them likes the colors Blue and Red equally .
Explanation:
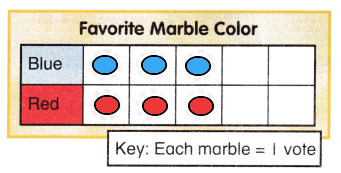
In the survey of 6 people,
3 of them like Blue
and 3 of them like Red
So, All of them likes the colors Blue and Red equally .
Use the tally chart to make a picture graph.
Question 1.
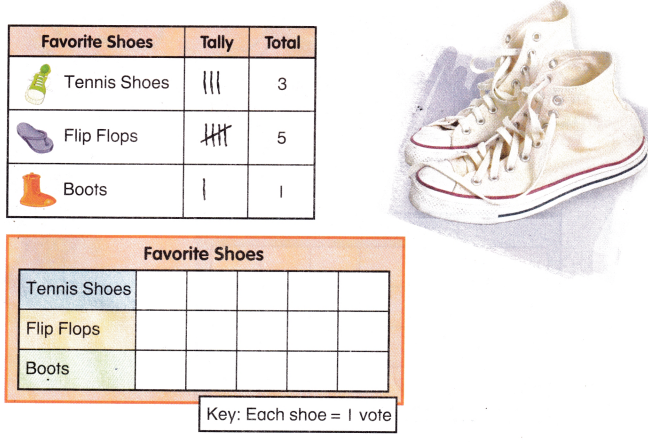
Answer: We used the tally chart to have a picture graph.
Explanation:
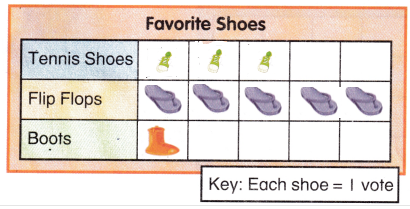
Here, Tennis shoes got 3 votes
Flip Flops got 5 votes
Boots got 1 vote
So, Highest people like Flip flops.
Talk Math How are picture graphs different from tally charts?
Answer: A picture graph displays data using symbols or pictures to represent the numbers.
A tally chart uses lines to represent the data being counted. Those lines are called tallies or tally marks.
On My Own
Use each tally chart to make a picture graph.
Question 2.
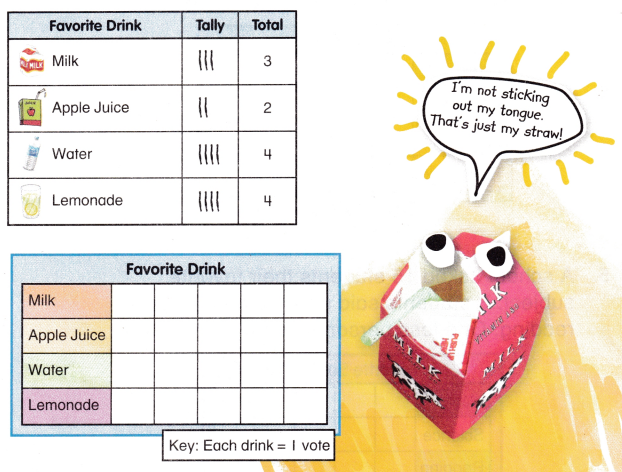
Answer: Both water and lemonade got the highest votes.
Explanation:
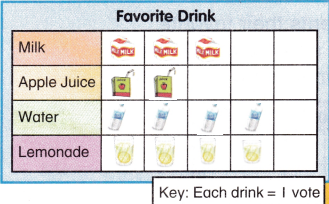
Here milk got 3 votes
Apple juice got 2 votes
Water got 4 votes
Lemonade got 4 votes
So, Both water and lemonade got the highest votes.
Question 3.
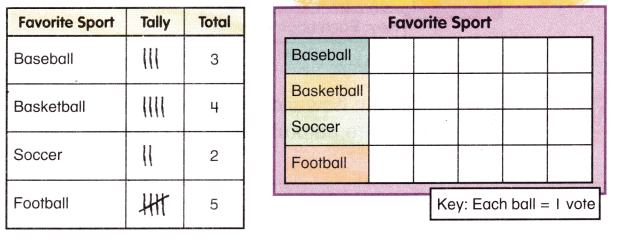
Answer: Football got the highest votes
Explanation:
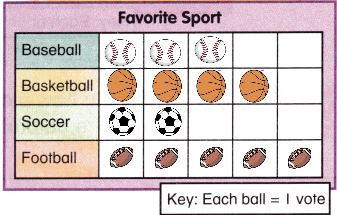
Here, Baseball got 3 votes
Basketball got 4 votes
Soccer got 2 votes
Football got 5 votes.
So, Football got the highest votes
Problem Solving
Use the information to make a picture graph.
Question 4.
Lilian asked ten people their favorite flower. One said tulips. The same number of people said daisies and carnations. 5 said roses.
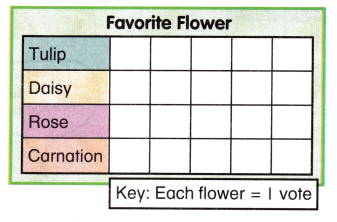
Answer: Rose is the flower most of the people liked .
Explanation:
Given, Lilian asked ten people their favorite flower. One said tulips.
The same number of people said daisies and carnations. 5 said roses.
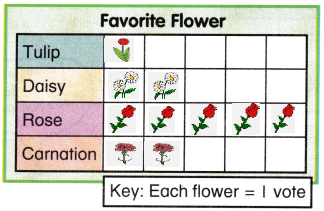
So, Rose is the flower most of the people liked .
Question 5.
A school asked 15 students their favorite subject. 3 students said science and 3 said reading. One less person said art than math.
Answer: The detailed explanation is given below
Explanation:
Given, A school asked 15 students their favorite subject.
3 students said science and 3 said reading.
One less person said art than math.
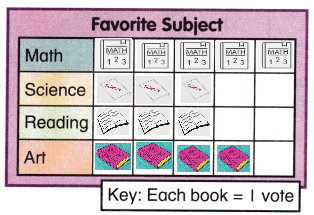
Here, Math got 5 votes
Science got 3 votes
Reading got 3 votes
Art got 4 votes.
So, out of 15 people 5 people like Math.
Write Math Explain how Picture graphs can be more helpful than tally charts.
Answer: A picture graph, or pictograph, is a graph used to display information that uses images or symbols to represent data.
Explanation:
A picture graph, or pictograph, is a graph used to display information that uses images or symbols to represent data.
Tally charts are used to collect data quickly and efficiently. Filling in a chart with marks representing numbers is faster than writing out words or figures and the data is collected into sub-groups immediately, making it easy to analyze.
McGraw Hill My Math Grade 2 Chapter 9 Lesson 2 My Homework Answer Key
Practice
Use the tally chart to make a picture graph.
Question 1.
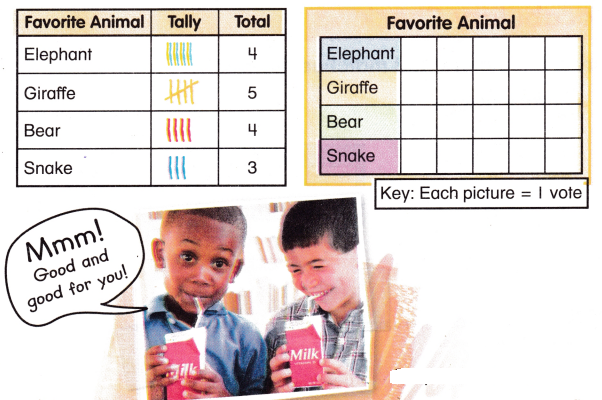
Answer: Giraffe got the highest votes.
Explanation:
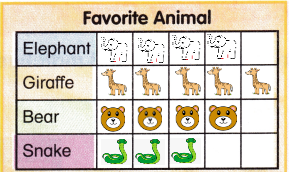
Here, Elephant got 4 votes
Giraffe got 5 votes
Bear got 4 votes
Snake got 3 votes
So, Giraffe got the highest votes.
Question 2.
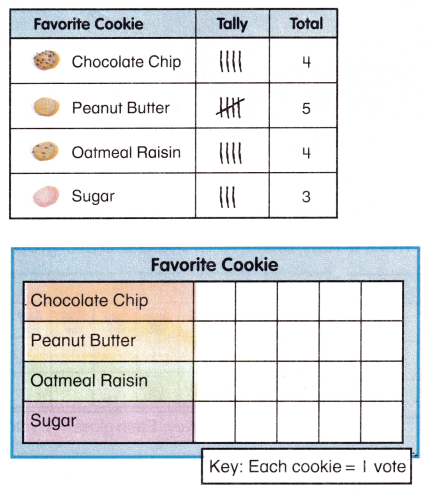
Answer: Peanut butter got highest votes
Explanation:
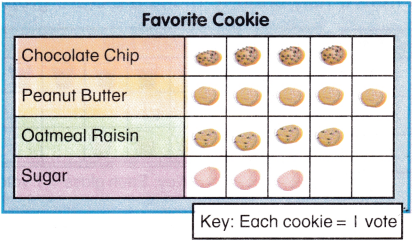
Here, Chocolate Chip got 4 votes
Peanut butter got 5 votes
Oatmeal Raisin got 4 votes
Sugar got 3 votes
So, Peanut butter got highest votes
Vocabulary Check
Circle the picture that matches the word.
Question 3.
picture graph
Answer: A picture graph, or pictograph, is a graph used to display information that uses images or symbols to represent data.
Explanation:
Math at Home Construct a large picture graph. Have your family graph their favorite dinner.
Answer: Here giving the example of a picture graph
Explanation:
For Example,
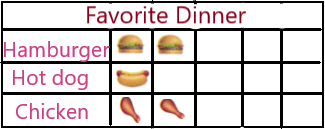
Here, we took a survey on favorite dinner among the family members
Hamburger got 2 votes
Hot dog got 1 vote
Chicken got 2 votes.
So, Chicken and Hamburger are the most favorite dinner among the family members.