We included HMH Into Math Grade 6 Answer Key PDF Module 16 Review to make students experts in learning maths.
HMH Into Math Grade 6 Module 16 Review Answer Key
Vocabulary
Choose the correct term from the Vocabulary box.
Vocabulary
box plot
lower quartile
upper quartile
mean absolute deviation (MAD)
measure of variability
range
interquartile range (IQR)
Question 1.
The mean distance of the data values from the mean of a data set is called the _____________.
Answer:
Mean absolute deviation.
Question 2.
A ___________ is a graph that shows the distribution of data using the median, quartiles, least value, and greatest value.
Answer:
Box plot.
Question 3.
The median of the lower half of a data set is called the ___________.
Answer:
Lower quartile.
Question 4.
A single value used to describe how the values in a data set are spread out is a ____________.
Answer:
Measure of variability.
Question 5.
The _____________ is the median of the upper half of a data set.
Answer:
Upper quartile.
Question 6.
The difference between the greatest and least values in a data set is the _____________.
Answer:
Range.
Question 7.
The _____________ is the difference between the upper and lower quartiles in a data set.
Answer:
Interquartile range.
Concepts and Skills
Question 8.
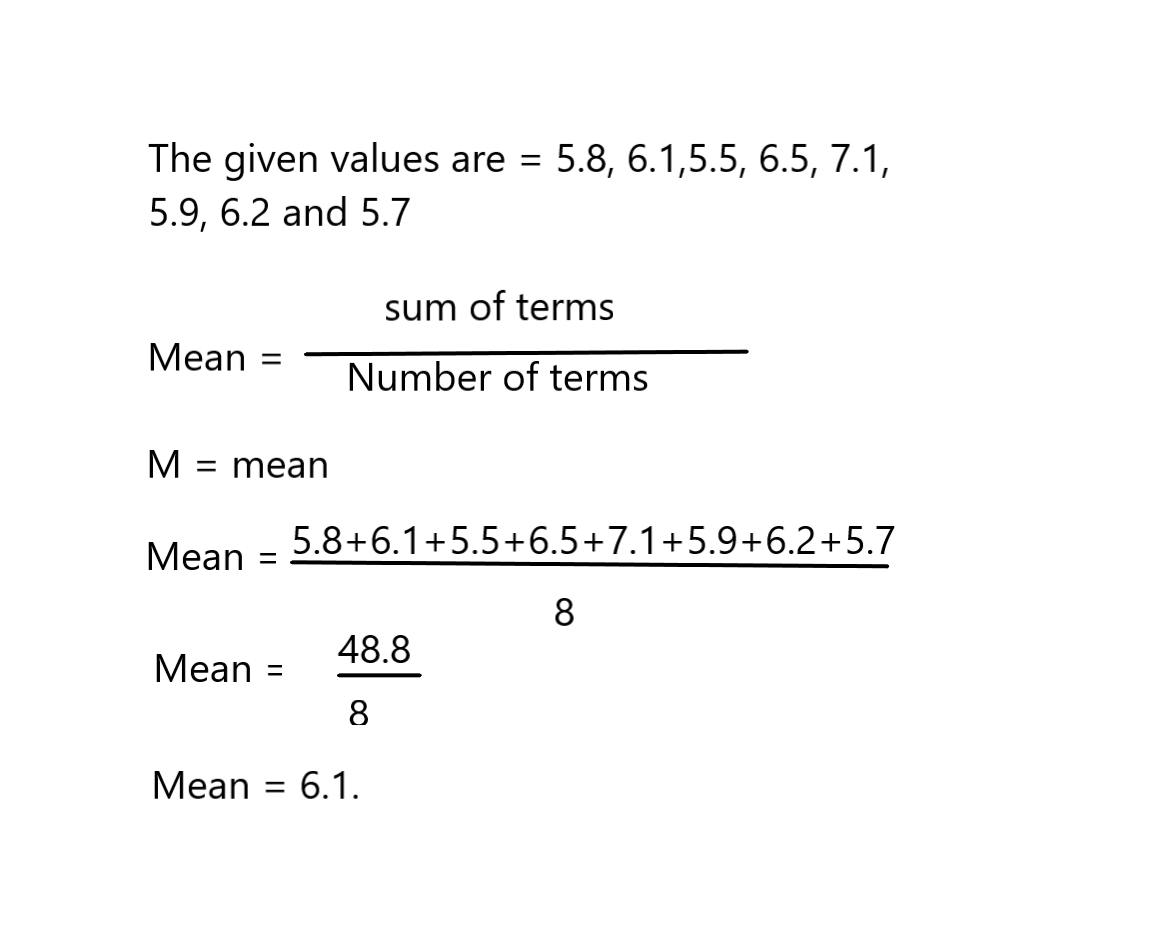
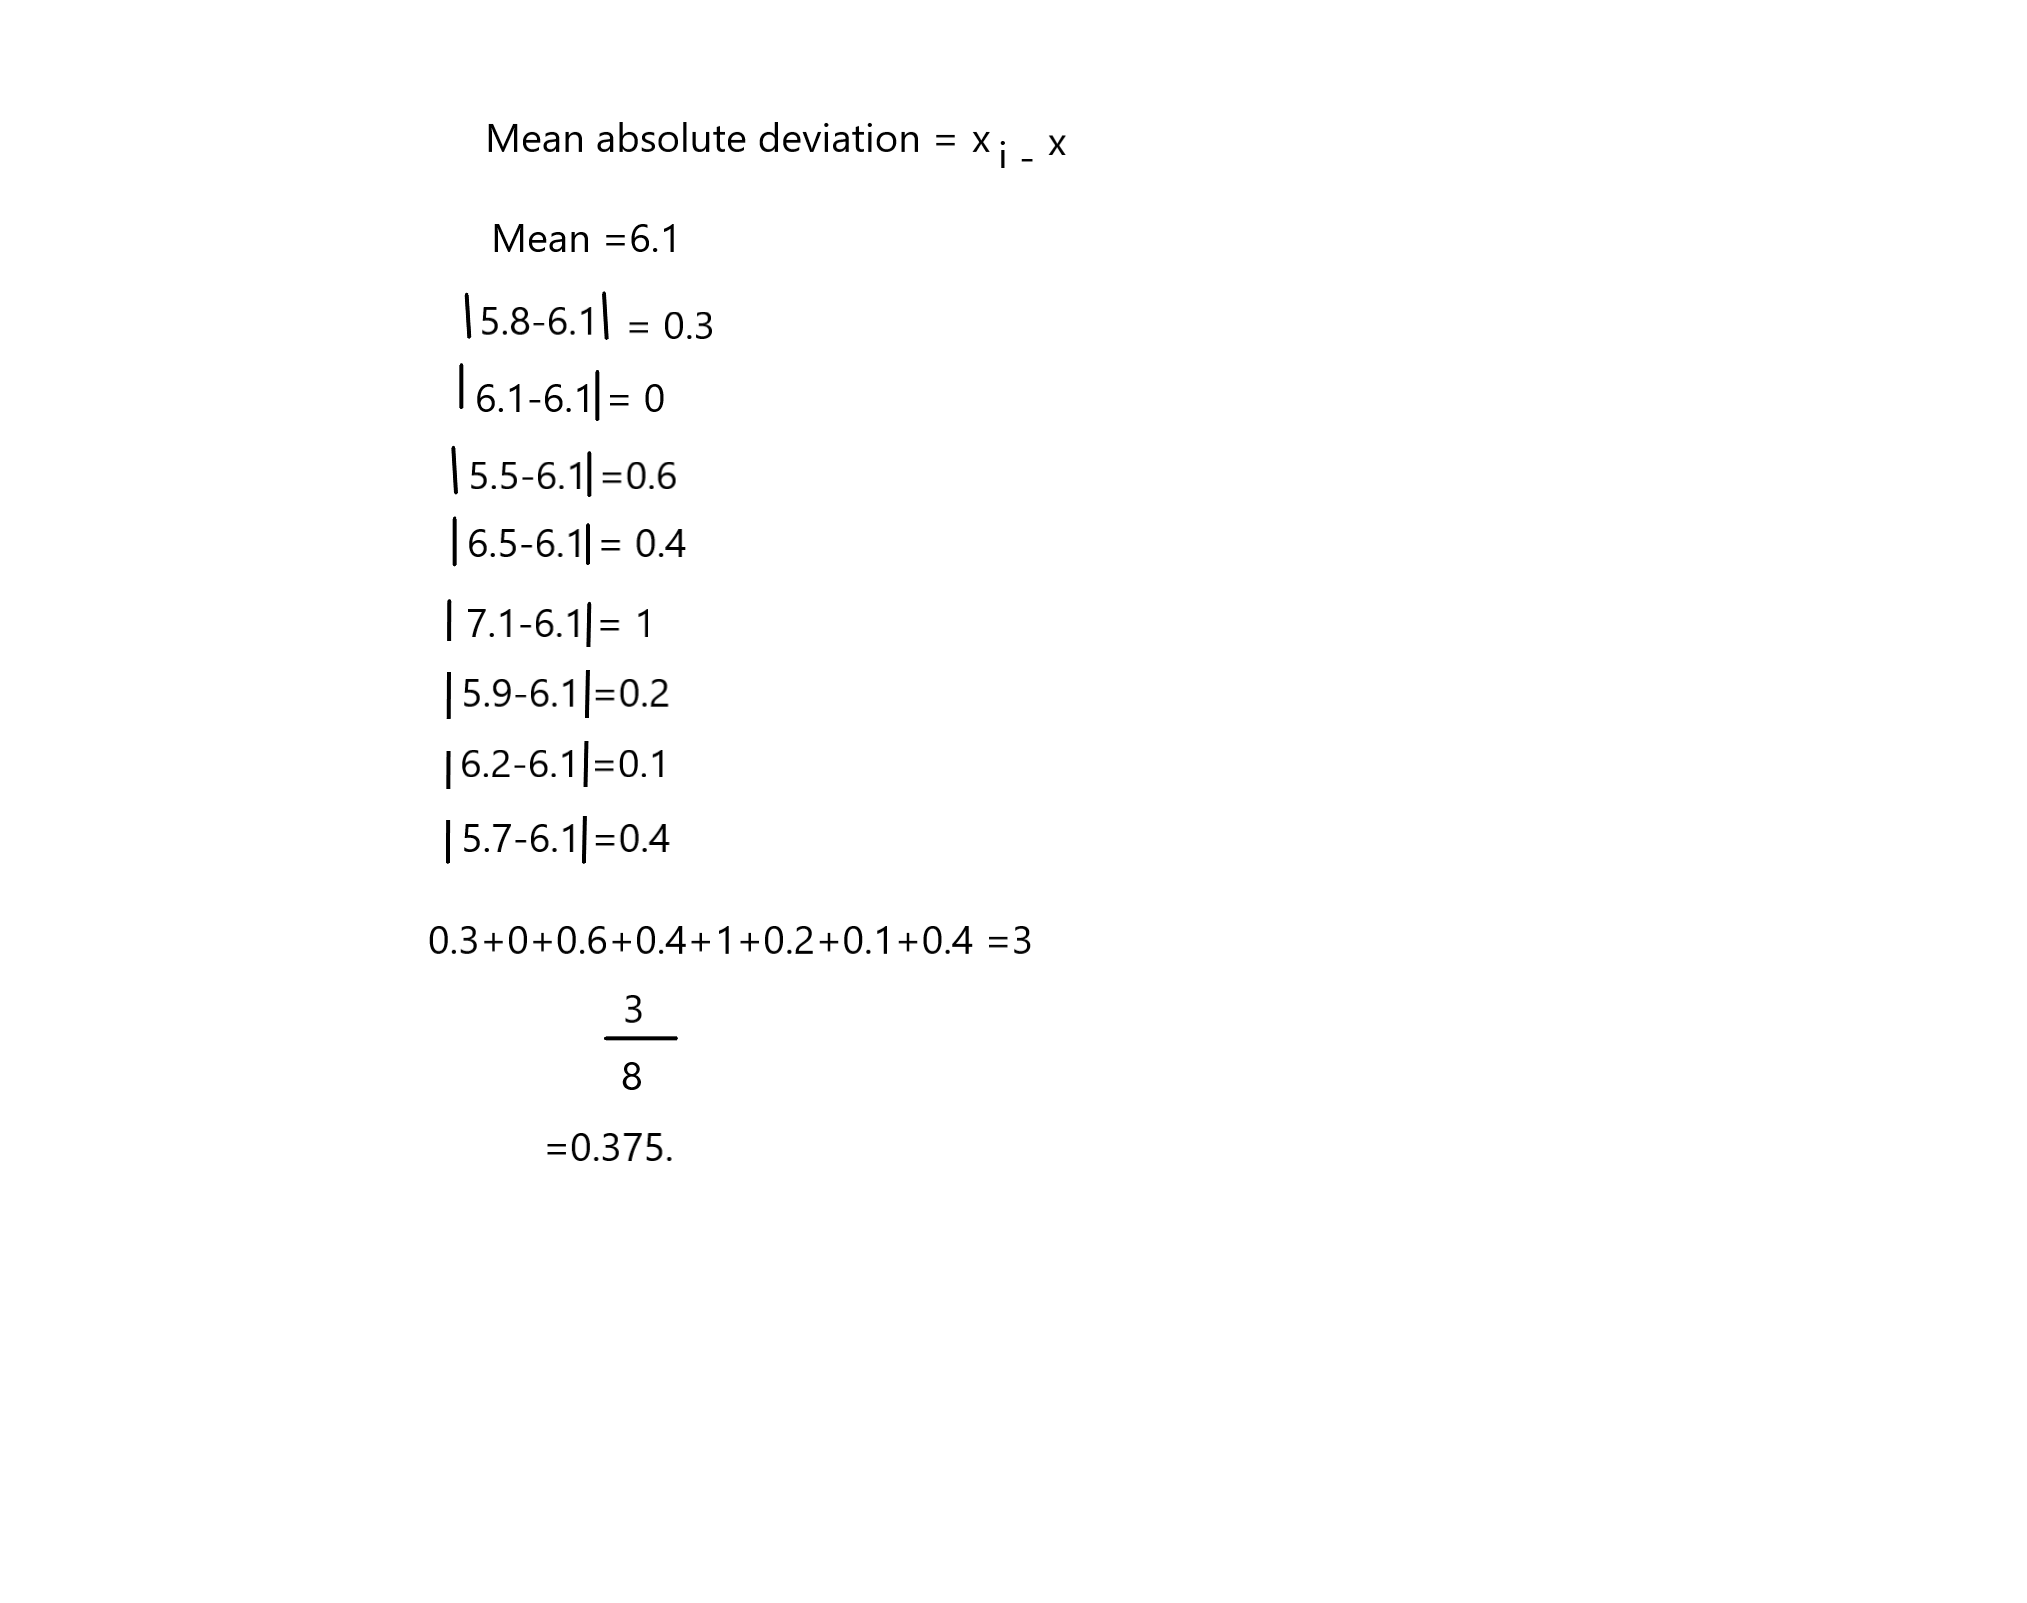
Use Tools Eight chickens on a farm are weighed. Their weights are 5.8, 6.1, 5.5, 6.5, 7.1, 5.9, 6.2, and 5.7 pounds. What are the mean and the mean absolute deviation of the weights? State what strategy and tool you will use to answer the question, explain your choice, and then find the answer.
Answer:
Eight chickens on a farm are weighed
Question 9.
Look at the histogram. Which statement best describes the data shown in the graph?
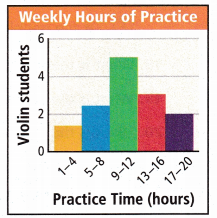
(A) The data have a peak at 13 to 16.
(B) The data have an outlier at 0 and 10.
(C) The data have a cluster from 13 to 20.
(D) The data are approximately symmetric.
Answer:
For Problems 10-12, use the following information.
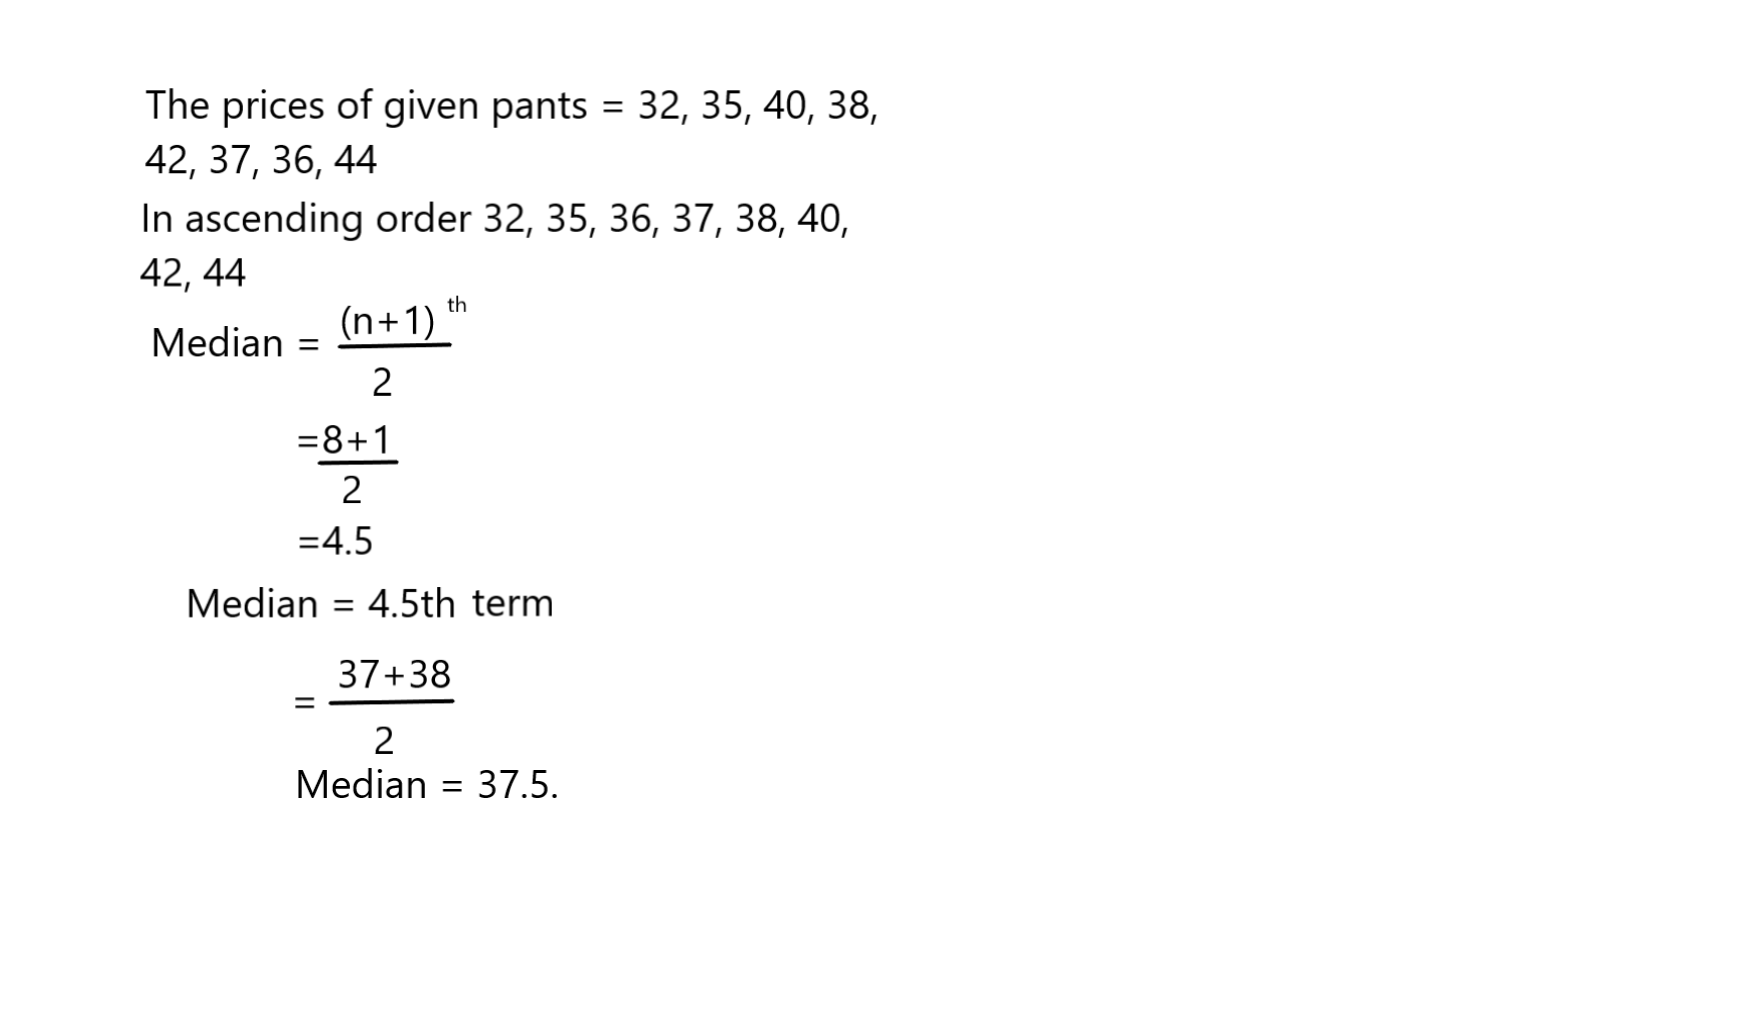
Eight stores at the mall sell the same style of pants. The prices of the pants are: $32, $35, $40, $38, $42, $37, $36, $44.
Question 10.
What is the median of the prices?
Answer:
Question 11.
What is the lower quartile of the prices?
Answer:
The lower quartile price is 32$.
Question 12.
What is the upper quartile of the prices?
Answer:
The upper quartile of the prices is 44$.
For Problems 13-16, use the dot plot. Round to the nearest tenth.
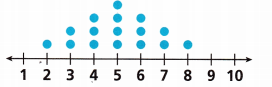
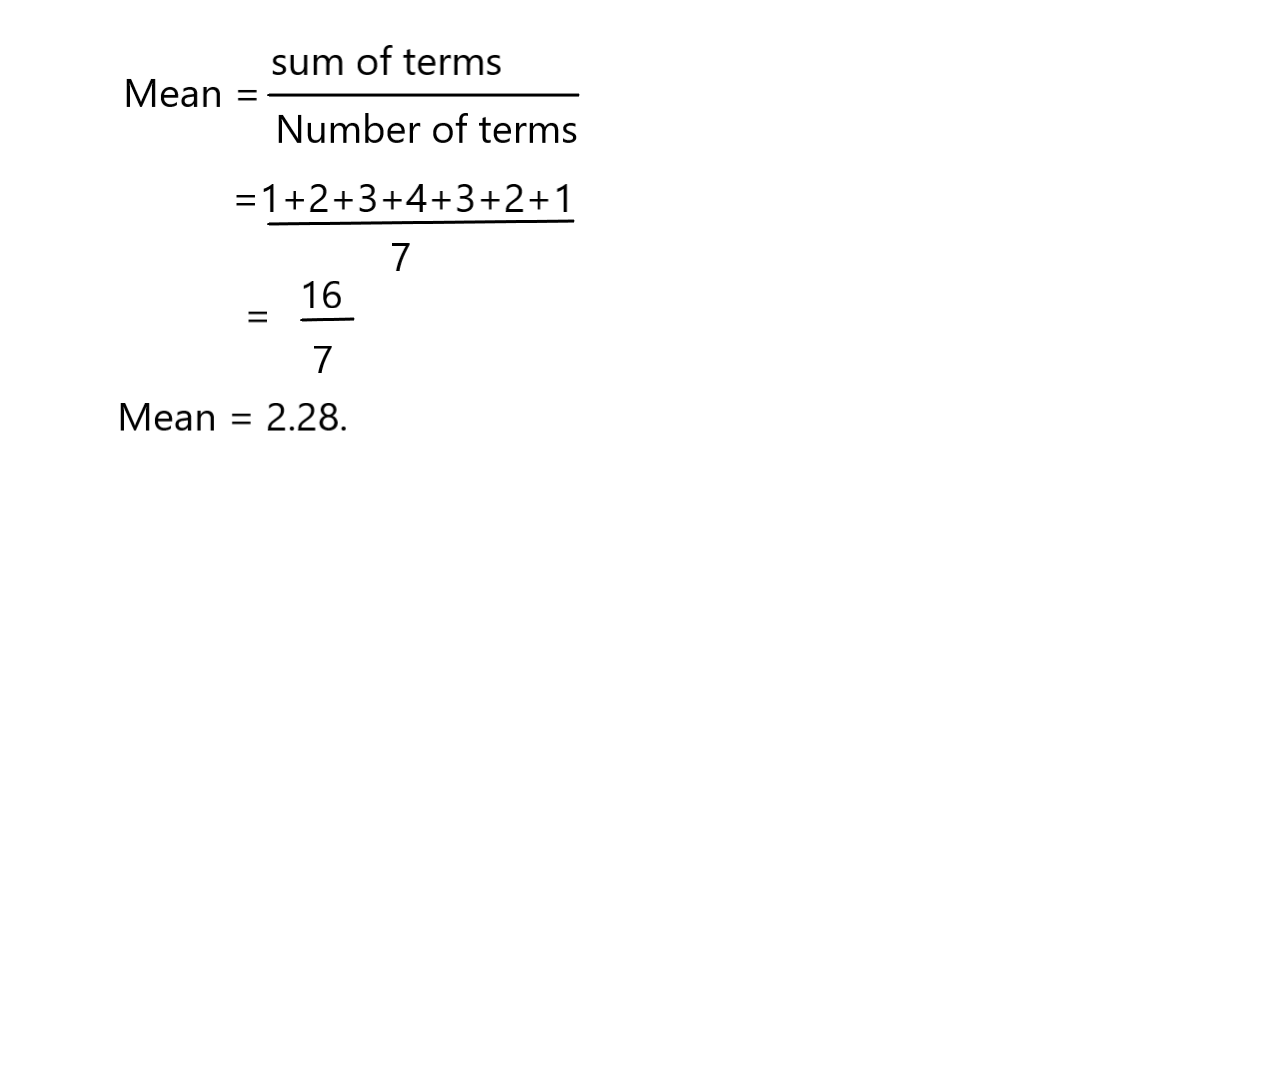
Question 13.
What is the mean of the data?
Answer:
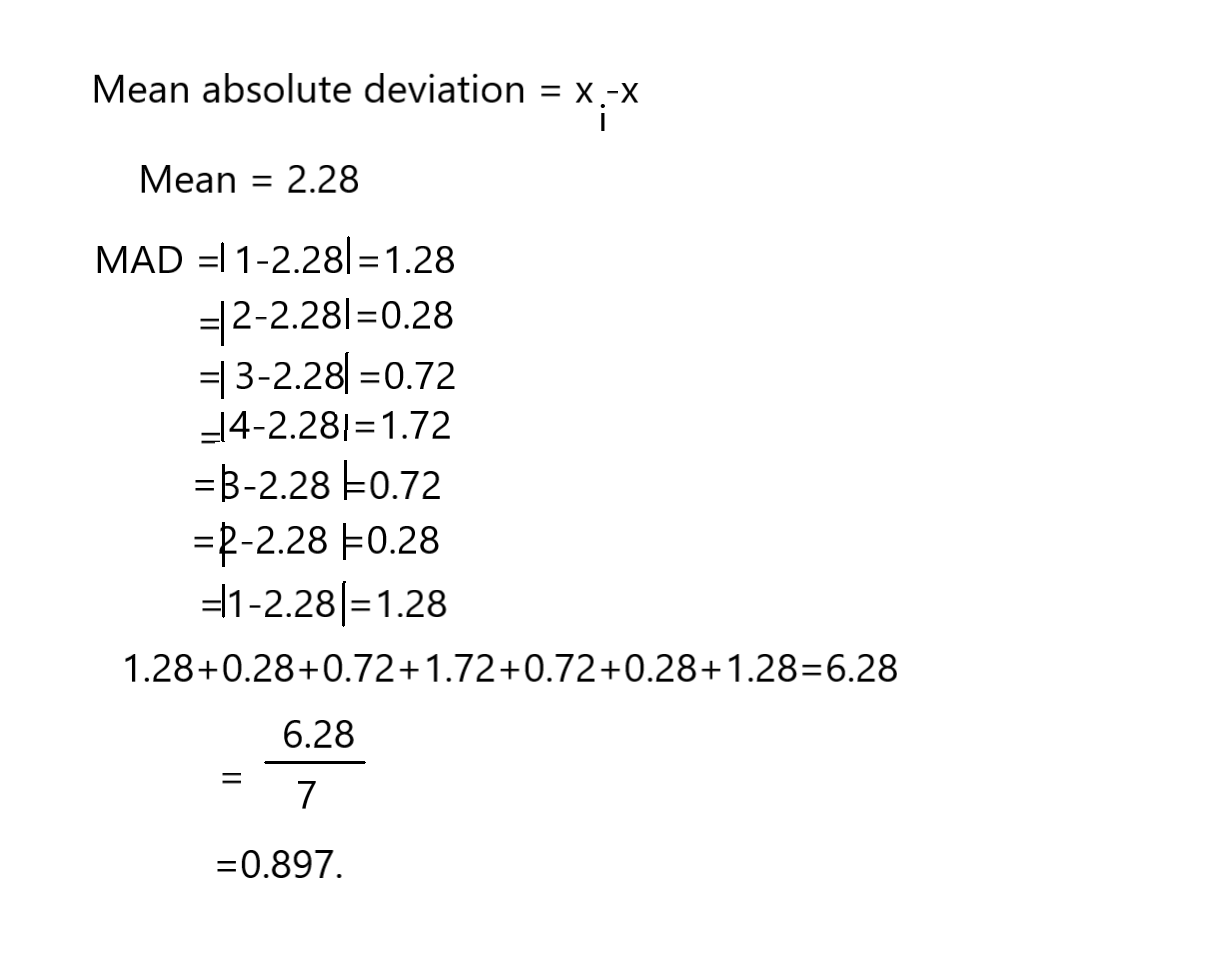
Question 14.
What is the mean absolute deviation of the data?
Answer:
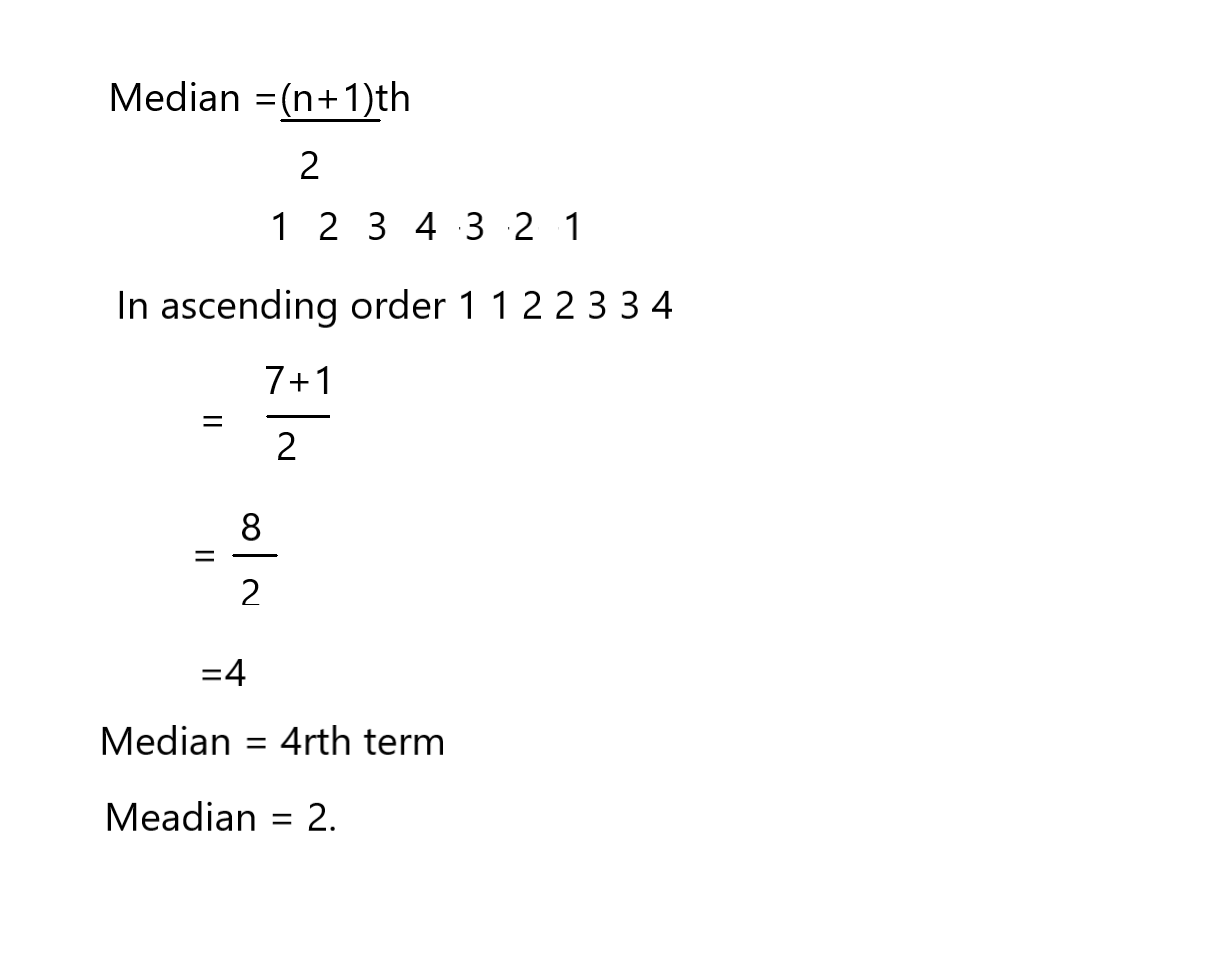
Question 15.
What is the median of the data?
Answer:
Question 16.
Circle the data values that fall within the mean absolute deviation.
Answer:
For Problems 17-21, use the box plot shown.

Question 17.
Which statements describe the distribution of the data in the box plot? Select all that apply.
(A) Of the people surveyed, \(\frac{1}{2}\) own 7 to 13 pairs of pants.
(B) Of the people surveyed, \(\frac{1}{4}\) own 3 to 10 pairs of pants.
(C) Of the people surveyed, \(\frac{1}{2}\) own 13 to 18 pairs of pants.
(D) Of the people surveyed, \(\frac{1}{4}\) own 3 to 7 pairs of pants.
(E) Of the people surveyed, \(\frac{3}{4}\) own 10 to 18 pairs of pants.
Answer:
Of the people surveyed, \(\frac{1}{4}\) own 3 to 7 pairs of pants.
Question 18.
What is the median of the data?
Answer:
10
Explanation:
The median of the data is 10.
Question 19.
What is the range of the data?
Answer:
18
Explanation:
The difference between the smallest and highest numbers in the given data that is 20 – 2 = 18.
Question 20.
What is the interquartile range?
Answer:
20
Explanation:
The difference between the upper and lower medians is called interquartile range.
0, 2, 4, 6, 8, 10, 12, 14, 16, 18, 20
First, we will find the median of a set with an even number of values.
Find the median of the lower portion.
The median of the lower portion is Zero and the median of the upper portion is 20. Now we need to calculate the difference of the upper and lower medians by subtracting the lower median from the upper median.
Therefore the interquartile range is 20 – 0 = 20.
Question 21.
Looking at the shape of the data distribution, which measure of variability would best represent the data?
Answer: