We included HMH Into Math Grade 4 Answer Key PDF Module 19 Lesson 5 Represent and Interpret Measurement Data in Line Plots to make students experts in learning maths.
HMH Into Math Grade 4 Module 19 Lesson 5 Answer Key Represent and Interpret Measurement Data in Line Plots
I Can make a line plot and use a line plot to answer questions.
Connect to Vocabulary
A line plot is a graph that records each piece of data on a number line.
Step It Out
Question 1.
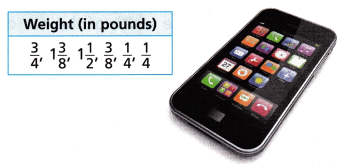
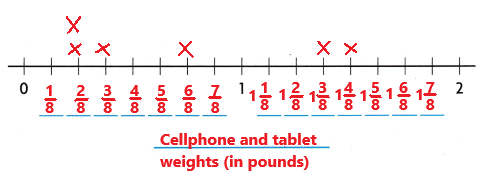
The weights of some cellphones and tablets are shown. How can you display the data using a line plot?
A. Order the data from least to greatest.
Answer:
The weights of some cellphones and tablets data are given in pounds.
The given data are 3/4, 1 3/8, 1 1/2, 3/8, 1/4, 1/4.
The mixed fraction 1 3/8 in fraction form as 11/8.
The mixed fraction 1 1/2 in fraction form as 3/2.
The given data from least to greatest are 1/4, 1/4, 3/8, 3/4, 1 3/8, 1 1/2.
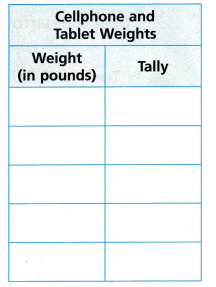
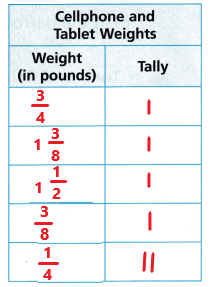
B. Complete the tally table.
Answer:
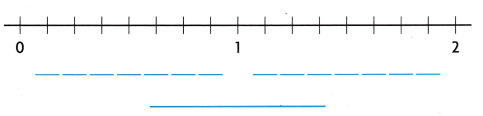
C. To determine the intervals, look at the fractions and determine which common denominator you could use. Which interval would you use to make the number line?
Answer:
We can use common denominator as 8. The interval used to make the number line is 1/8.
D. Label the fraction lengths on the number line. Plot an X for each data point. Write a title, and label the units used.
Answer:
Question 2.
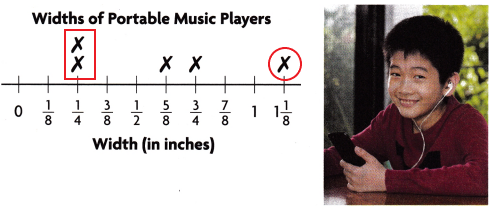
The line plot shows the widths of different portable music players. How much greater is the width of the widest portable music player than the narrowest?

A. Draw a box around the value that shows the width of the narrowest portable music player. Draw a circle around the value for the widest.
Answer:
B. Determine which operation to use to find the answer. Write an equation and solve.
Answer:
The operation I used to find the answer is subtraction.
The mixed fraction of 1 1/8 is 9/8.
The equation is 1 1/8 – 1/4
9/8 – 1/4 = 7/8
C. The widest portable music player is inches wider than the narrowest.
Answer:
The widest portable music is 9/8.
The narrowest portable music is 1/4.
9/8 – 1/4 = 7/8
The widest portable music player is 7/8 inches wider than the narrowest.
Turn and Talk How does knowing equivalent fractions help you make a line plot?
Answer:
Check Understanding
Question 1.
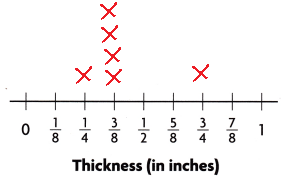
The thicknesses of different e-readers are shown.
\(\frac{3}{8}\) in., \(\frac{3}{4}\) in., \(\frac{3}{8}\) in., \(\frac{3}{8}\) in., \(\frac{3}{8}\) in., \(\frac{1}{4}\) in.,
Show the data on a line plot.
Answer:
Question 2.
Suppose all the e-readers were stacked on top of each other. What would the thickness of the stack of e-readers be?
Answer:
The thicknesses of different e-readers are in inches 3/8, 3/4, 3/8, 3/8, 3/8, 1/4.
The e-readers were stacked on top of each other.
3/8 + 3/4 + 3/8 + 3/8 + 3/8 + 1/4 = 20/8 inches
The thickness of the stack of e-readers be 20/8 or 5/2 inches.
On Your Own
Question 3.
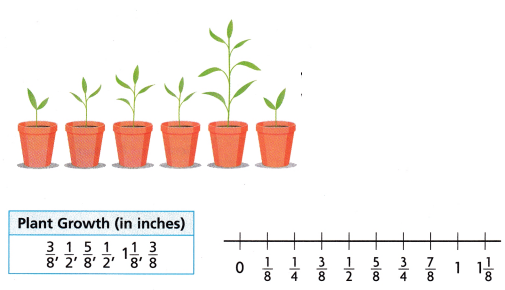
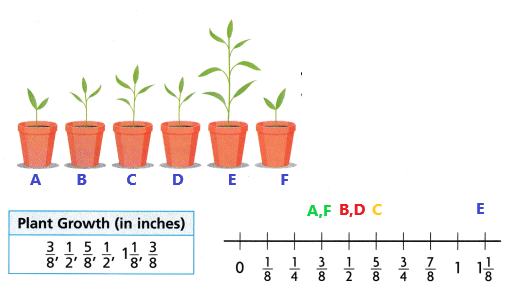
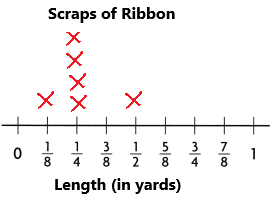
Model with Mathematics Erik measures how much six plants grow in two weeks. Make a line plot to display the data. Include a title and label the units.
Answer:
Question 4.
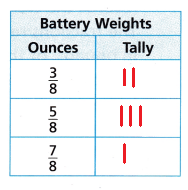
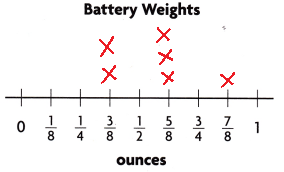
The data show the different weights of some AA and AAA batteries. Complete the tally table, and make a line plot to represent the data.
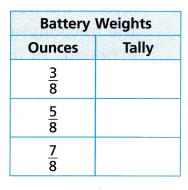
\(\frac{3}{8}\) oz, \(\frac{5}{8}\) oz, \(\frac{7}{8}\) oz, \(\frac{5}{8}\) oz, \(\frac{3}{8}\) oz, \(\frac{5}{8}\) oz
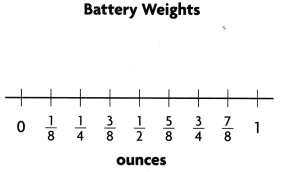
Answer:
Question 5.
The line plot shows the distances Sara walks at different times of the day according to her pedometer.
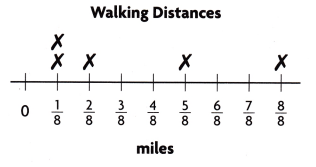
How far does Sara walk during the day?
Answer:
1/8 + 1/8 + 2/8 + 5/8 + 8/8 = 17/8 miles
Sara walk 17/8 miles during the day.
Question 6.
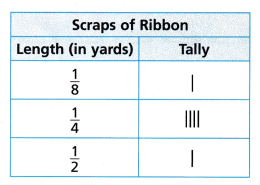
Attend to Precision Use the tally table to make a line plot to represent the data.
Answer:
Question 7.
Use Tools A wildlife center records the weights of six reptiles. The fractions represent the weights, in pounds, of the reptiles. Make a line plot to display the data. What is the difference in weight between the heaviest and lightest reptiles weighed?
\(\frac{5}{8}\), \(\frac{9}{8}\), \(\frac{5}{8}\), \(\frac{7}{8}\), \(\frac{7}{8}\), \(\frac{8}{8}\)
Answer:
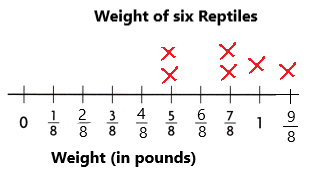
The weight of the heaviest reptile is 9/8 pounds.
The weight of the lightest reptile is 5/8 pounds.
9/8 – 5/8 = 4/8 pounds
The difference between the heaviest and lightest reptiles weighed is 4/8 pounds.
Question 8.
Open Ended Why might you use a line plot to display data? Give an example of a situation where you would use a line plot, and explain why.
Answer:
Using line plot to display data gives us clear picture of the measurement of how much units the object is and also easily comparable with other objects.