We included HMH Into Math Grade 3 Answer Key PDF Module 18 Lesson 5 Use Line Plots to Display Measurement Data to make students experts in learning maths.
HMH Into Math Grade 3 Module 18 Lesson 5 Answer Key Use Line Plots to Display Measurement Data
I Can use a line plot to display measurement data.
Spark Your Learning
Nina measures the length of 2 candles, each from a different package. What is the length of each candle?
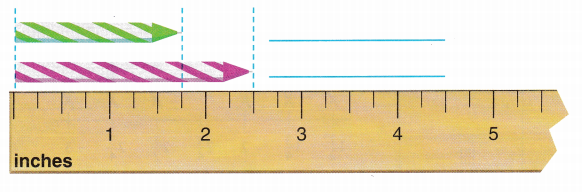
Show how Nina might represent each length on a number line.
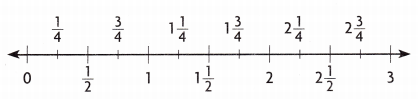
Turn and Talk How could you show two candles with the same length on a number line?
Answer:
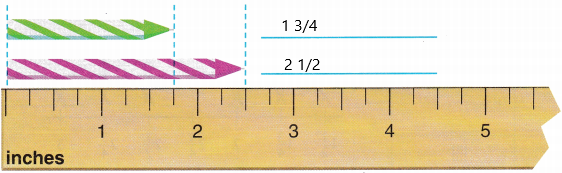
If we add an extra 3/4 length to the above candle then both the candles will be the same length on the number line.
1 3/4+3/4
If we calculate this:
Add 1 3/4+3/4 then we get 10/4.
now convert mixed number to improper fraction
1 3/4=1*4/4+3/4
=4+3/4
=7/4.
Now add:
7/4+3/4
=7+3/4
=10/4
=5/2 in the mixed form we can write as 2 1/2.
so definitely if we add 3/4 they both will have same length.
Build Understanding
Question 1.
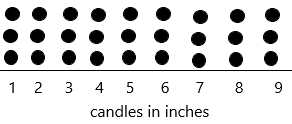
Kendrick makes candles. He records the number of candles and their lengths in a tally chart. Then he makes a line plot of the data.
Connect to Vocabulary
You already have used number lines. A line plot is a graph that uses marks to record each piece of data above a number line.
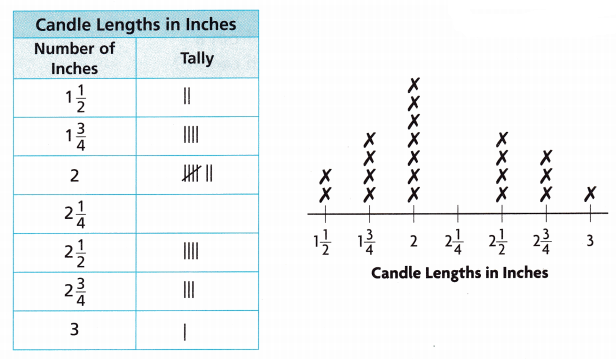
A. Which candle length does Kendrick make most often?
Answer:
The candle length 2 has the most tally.
Compare to all the lengths, 2 length has 7 marks.
Therefore, Kendrick makes the most is 2 length candle.
B. Which candle length does he make only once?
Answer:
Now observe the line plot, the candle length 3 has been recorded only one time.
C. How do you know if there are any candle lengths on the line plot for which no data was collected?
Answer:
The length 2 1/4 has recorded nothing. In the line plot, we get to know easily. No marks will be represented on the length of 2 1/4.
That’s why we can easily say that no data was collected.
D. How can you describe the data?
Answer: describing the data through methods such as graphical representations, measures of central tendency and measures of variability. It summarizes the data in a meaningful way which enables us to generate insights from it.
– This describes the relationship between two variables or data sets.
Turn and Talk In what ways are the chart and the line plot alike? How are they different?
Answer: A line chart is a type of chart that displays information as a series of data points called markers connected by straight line segments. A line plot can be considered a special type of line chart.
– A line chart is a graphic representation of data, while a line plot is a result of plotting statistics as a diagram in different ways.
– And moreover, a line chart can be a useful way to see the relationship between two sets of data.
Step It Out
Question 2.
Bob’s Candle Shop sells candle wicks with different lengths.
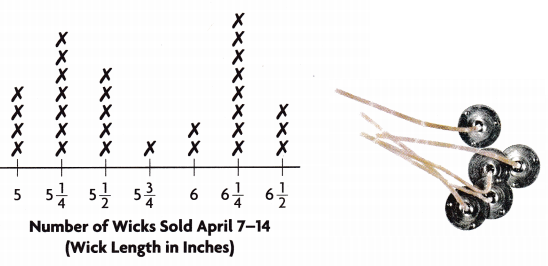
You can use a line plot to compare data.
A. The shortest wick length is _________ inches.
Answer:
The shortest wick length is 5 3/4 inches.
Because compared to all inches that are the only one having low inch.
B. The shop sold _________ of the shortest wick.
Answer:
the shop sold 1 of the shortest wick.
C. The longest wick length is _________ inches.
Answer: The longest wick length is 6 1/4 inches.
Because compared to all inches that are the only one having high inch.
D. The shop sold __________ of the longest wick.
Answer: The shop sold 8 of the longest wick.
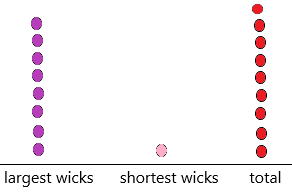
E. Compare the data for the shortest and longest wicks. The shop sold _________ more of the _______ wick than the ______ wick.
Answer:
The number of longest wicks the shop sold=8
The number of shortest wicks the shop sold=1
the shop sold X more of the X1 wick than the X2 wick.
X=longest wicks-shortest wicks
X=8-1
X=7
The shop sold 7 more of the longest wicks than the shortest wicks.
Check Understanding
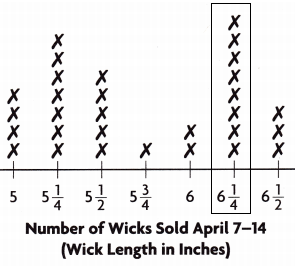
Use the line plot above.
Question 1.
How many wicks did the shop sell?
Answer:
The number of longest wicks the shop sold=8
The number of shortest wicks the shop sold=1
The total number of wicks=8+1=9
A-Line plot can be defined as a graph that displays data as points or checkmarks above a number line, showing the frequency of each value.
Question 2.
The shop sold the most of which wick length?
Answer:
A line plot, also called a dot plot, is a graph that shows the frequency, or the number of times, a value occurs in a data set.
Line plots are constructed with each value recorded along the horizontal axis, also called the x-axis. These values can be measurements, weekdays, months, colours, sports, types of food, or anything else one wants to record with a line plot. The number of times each value occurs is marked above that value on the plot. There are a few ways of doing this. A person might draw an X or dot above the value for each occurrence, or a single dot that corresponds to a number written on the vertical y-axis. All line plots should have a title to indicate what data the plot shows. Line plots allow people to evaluate frequency in data sets, which can be helpful for future discussion and research.
On Your Own
Use the line plot for 3-6.
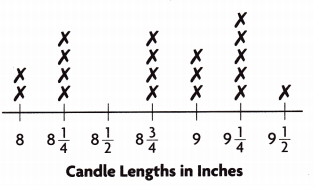
Faith and Raul use some candles at a party. After the party, they measure the lengths of the candles.
Question 3.
Critique Reasoning Faith says candle Lengths in inches the line plot shows that 9 candles have a length of 3 inches. Describe the mistake Faith makes.
Answer:
After the party, they measured some candles out of some candles Faith said 9 candles are having the 3 inches. No mistake is there. According to the line plot Faith said correctly.
Question 4.
How many more candles have a length of 9\(\frac{1}{4}\) inches than a length of 8 inches?
Answer:
The candles have a length of 9 1/4 is 5
The candles have a length of 8 is 2
The number of more candles have a length of 9 1/4 inches than a length of 8 inches=X
X=5-2
X=3
Therefore, 3 more candles have a length of 9 1/4 inches than a length of 8 inches.
Question 5.
How many candles do Faith and Raul use?
Answer: 19 candles.
According to the line plot,
The candle length 8 is 2
The candle length of 8 1/4 is 4
The candle length of 8 1/2 is 0
The candle length of 8 3/4 is 4
The candle length of 9 is 3
The candle length of 9 1/4 is 5
The candle length is of 9 1/2 is 1
Now add all the candles:2+4+0+4+3+5+1
The number of candles they both were used is 19.
Question 6.
STEM There are three states of matter: solid, liquid, and gas. The heat from a lit candle makes solid wax become liquid wax. How many candles dripped to a length of less than 8\(\frac{1}{2}\) inches?
Answer:
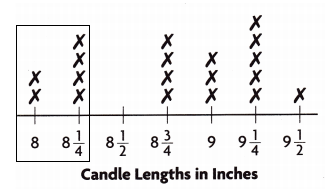
The candles length of 8 1/4 is 4
The candles length of 8 is 2
8 and 8 1/4 are less than 8 1/2.
Now add to get the number of candles dripped.
4+2=6
therefore 6 candles dripped to a length of fewer than 8 1/2 inches.
I’m in a Learning Mindset!
What do I know about line plots?
Answer:
Line plots are a useful way to compare sets of data or track changes over time. You can plot the data in a 2-D or 3-D view using either a linear or a logarithmic scale. Also, you can plot expressions or functions over specific intervals. Create a 2-D line plot and specify the line style, line colour, and marker type.
– They are useful for visualizing data.
– You can use them to represent many different things like relationships between quantities.
– Line plots are also used in statistics and business management.