We included HMH Into Math Grade 3 Answer Key PDF Module 18 Lesson 7 Solve One and Two-Step Problems Using Data to make students experts in learning maths.
HMH Into Math Grade 3 Module 18 Lesson 7 Answer Key Solve One and Two-Step Problems Using Data
I Can use data in picture graphs, bar graphs, and line plots to solve one- and two-step how many more and how many less problems.
Step It Out
Question 1.
Pilar surveys the students in her group about their favorite summer activities. How many more students choose beach than pool and camp combined?
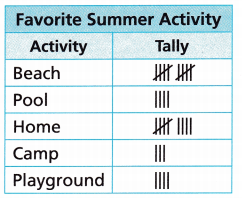
A. Make a picture graph of the data.
Answer:
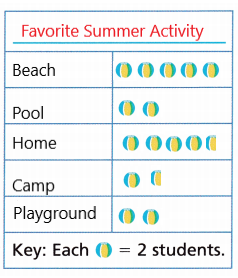
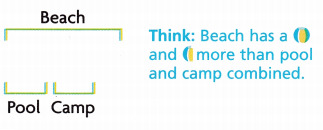
B. You can use the picture graph to solve the problem. Draw the symbols to compare these rows.
What does a half of a symbol stand for in the graph?
Answer:
A half symbol stand for 1 student.
C. What equations can you write to find how many more students choose beach than pool and camp combined?
Answer:
The equation to find the total number of students who choose pool and camp is 4 + 3= 7
The equation to find the students who choose beach more than pool and camp combined is 10 – 7= 3
D. __________ more students choose beach than pool and camp combined.
Answer:
3
Explanation:
Number of students choose Beach = 10
Number of students choose pool and camp = 4 + 3 = 7
10 – 7 = 3
Therefore, 3 more students choose beach than pool and camp combined.
Turn and Talk What other ways could you display and compare the same data?
Answer:
I can display and compare the data in the form of bar graph, pie chart and line graph.
Question 2.
A store collects data about camping tent sales over 4 months. How many fewer tents were sold in March and April combined than in June?
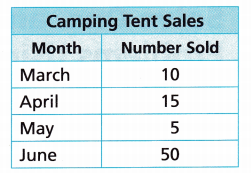
A. Make a bar graph of the data.
B. One way to solve the problem is to use the bar graph. Compare the bars.
Count back from 50 to 25.
Count by 10s and then by 5s.
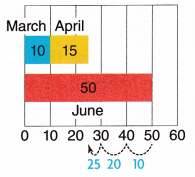
March and April combined have ________ fewer sales than June.
Answer:
25
Explanation:
Sales on March and April together = 10 +15 = 25
Sales on June = 50
50-25 = 25
Therefore, March and April combined have 25 fewer sales than June.
C. Another way is to draw a bar model and write equations.
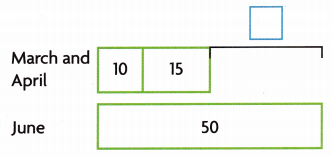
10 + 15 = __________
50 – ________ = ________
Answer:
10 + 15 = 25
50 – 25 = 25.
Turn and Talk How did you know what operations to use to solve each step of the comparison?
Answer:
If we need total we need to use addition operation and if we need to find the fewer we need to use subtraction operation.
Question 3.
Cari measures the length of 9 pieces of used chalk to the nearest half inch.
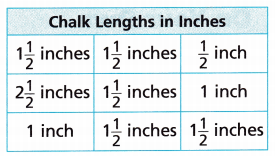
How many more chalk pieces have a length of 1\(\frac{1}{2}\) inches than lengths of \(\frac{1}{2}\) inch and 1 inch combined?
A. Make a line plot to show the data.
![]()
Answer:
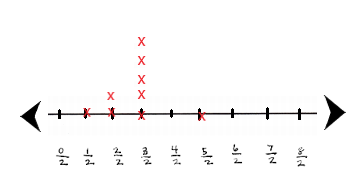
B. Use the line plot to solve the problem. Draw Xs to compare the columns of Xs.
There are _________ more Xs.
Answer:
2
Explanation:
There are 2 1inch and 2 \(\frac{1}{2}\) inch chalk pieces = 2+1 = 3
There are 5 1\(\frac{1}{2}\) inches chalk pieces
5 – 3 = 2
So, There are 2 more Xs.
C. What equations can you write to compare the Xs? How many more chalk pieces have a length of 1\(\frac{1}{2}\) inches than lengths of \(\frac{1}{2}\) inch and 1 inch combined?
Answer:
There are 2 more chalk pieces that have a length of 1\(\frac{1}{2}\) inches than lengths of \(\frac{1}{2}\) inch and 1 inch combined
Check Understanding
Use your line plot to answer the questions.
Question 1.
How many fewer chalk pieces have a length of 1 inch than lengths of 1\(\frac{1}{2}\) inches and 2\(\frac{1}{2}\) inches combined?
Answer:
5
Explanation:
There are 2 1inch chalk piece and
There are 5 1\(\frac{1}{2}\) inches chalk pieces and 1 2\(\frac{1}{2}\) inches chalk piece = 5+ 1 = 6
6 – 2 = 5
Therefore, 5 fewer chalk pieces have a length of 1 inch than lengths of 1\(\frac{1}{2}\) inches and 2\(\frac{1}{2}\) inches combined.
Question 2.
How many more chalk pieces have a length of 1\(\frac{1}{2}\) inches than lengths of 1 inch and 2\(\frac{1}{2}\) inches combined?
Answer:
2
Explanation:
There are 5 1\(\frac{1}{2}\) inches chalk pieces
There are 2 1inch chalk piece and 1 2\(\frac{1}{2}\) inches chalk piece = 2 + 1 = 3
5 – 3 = 2
Therefore, 2 more chalk pieces have a length of 1\(\frac{1}{2}\) inches than lengths of 1 inch and 2\(\frac{1}{2}\) inches combined.
On Your Own
Use the data in the tally chart for 3-7.
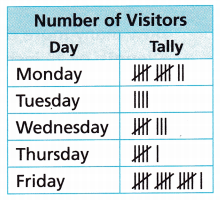
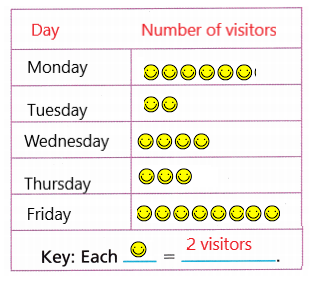
A museum collects data about the number of visitors with a museum membership.
Question 3.
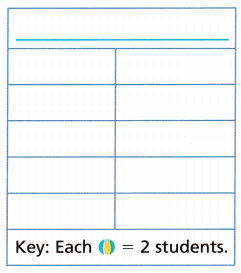
Attend to Precision Make a picture graph that shows the data in the table.
Answer:
Question 4.
How many fewer visitors are there on Tuesday than on Thursday and Friday combined?
Answer:
18
Explanation:
Number of visitors on Tuesday = 4
Number of visitors on Thursday and Friday = 6 +16 = 22
22 – 4 = 18
Therefore, 18 fewer visitors are there on Tuesday than on Thursday and Friday combined.
Question 5.
How many more visitors are there on Friday than on Monday?
Answer:
4
Explanation:
Number of visitors on Friday = 16
Number of visitors on Monday = 12
16 – 12 = 4
Therefore, 4 more visitors are there on Friday than on Monday.
Question 6.
Which day has half of the number of Monday’s visitors?
Answer:
Thursday
Explanation:
Number of visitors on Monday = 12
Number of visitors on Thursday = 6
So, Thursday has half of the number of Monday’s visitors.
Question 7.
Reason The museum has 12 more visitors with a museum membership on Saturday than on Friday. How many visitors have a museum membership on Saturday? Write an equation you can use to solve the problem. Explain.
Answer:
28 visitors
Explanation:
Number of visitors on Friday = 16
The museum has 12 more visitors with a museum membership on Saturday than on Friday
16 + 12 = 28
Therefore, 28 visitors have a museum membership on Saturday.