We included HMH Into Math Grade 2 Answer Key PDF Module 3 Lesson 5 Draw Bar Graphs to Represent Data to make students experts in learning maths.
HMH Into Math Grade 2 Module 3 Lesson 5 Answer Key Draw Bar Graphs to Represent Data
I Can draw a bar graph to show data, and then use the graph to solve problems.
Spark Your Learning
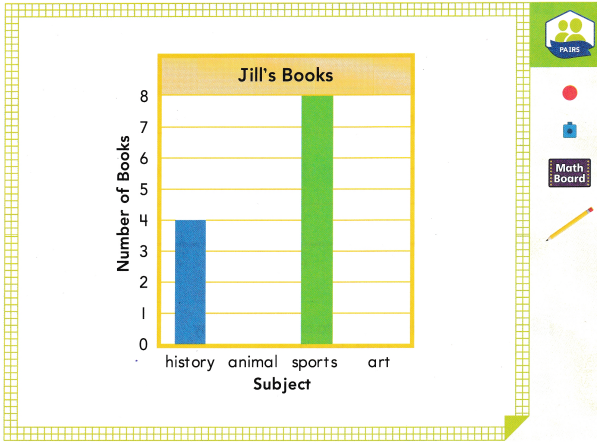
How can you show how many animal books Jill has?

Answer:
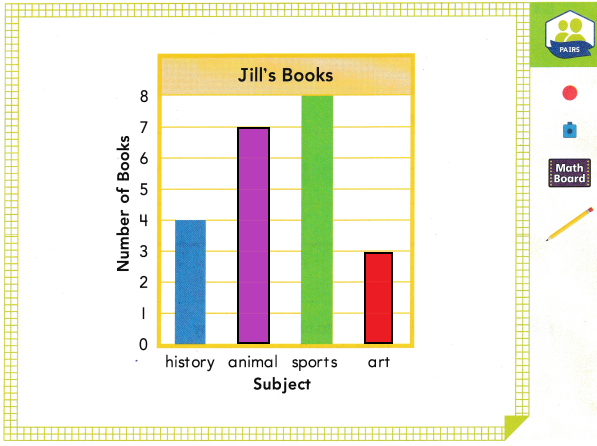
Answer:
Jill may have 7 animal books and 3 art books.
Have children work in pairs. Read the following problem: Jill has more animal books than history books, but fewer animal books than sports books. She has fewer art books than any other type of book. Complete the bar graph to show how many animal books and art books Jill might have.
Build Understanding
Adam asked his classmates to choose their favorite toy. Draw a bar graph to show the data.
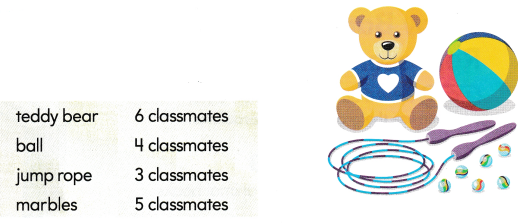
A. What is the survey about? Use that information to write a title and labels for the bar graph.
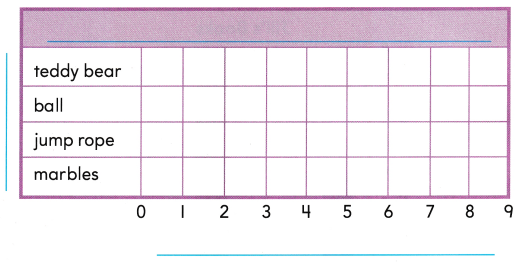
B. How can you draw a bar to show how many classmates chose teddy bear?
C. How con you draw bars to show how many classmates chose ball, jump rope, and marbles?
Answer:
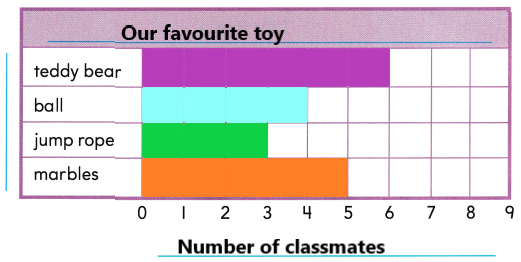
D. Which toy did the most classmates choose?
Answer:
Most of the classmates chose teddy bear as their favorite toy that is 6 classmates.
Turn and Talk How do you know how long to draw each bar?
Step It Out
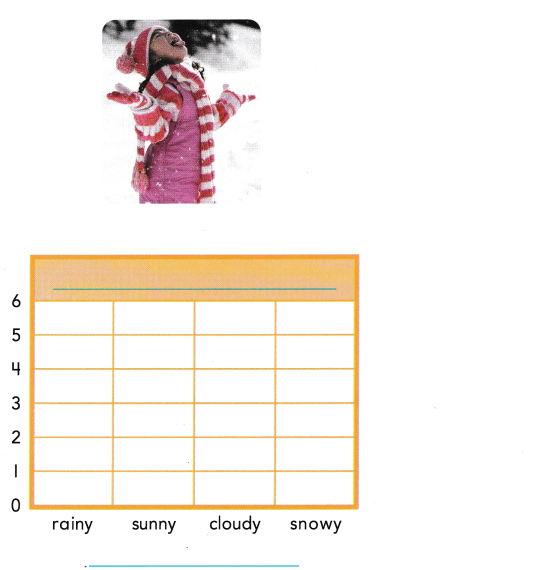
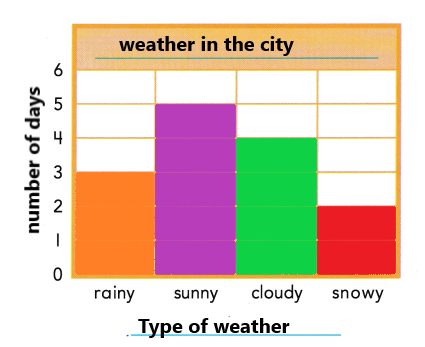
1. Kenja recorded the weather in her city for two weeks. There were 3 rainy days, 5 sunny days, 4 cloudy days, and 2 snowy days.
A. Write a title for the bar graph.
B. Write a label for the left side and bottom of the graph.
C. Draw a bar for each kind of weather.
Answer:
Check Understanding
Use the bar graph above to solve the problem.
Question 1.
How would the graph change if there were 3 more snowy days to record?
Answer:
Yes, the graph will change if there were 3 more snowy days in the record, there will be 6 snowy days in the graph.
On Your Own
Question 2.
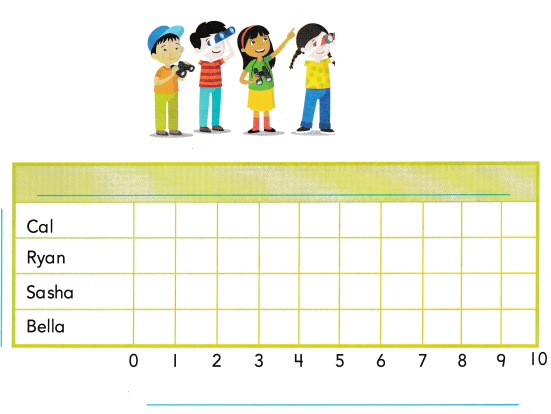
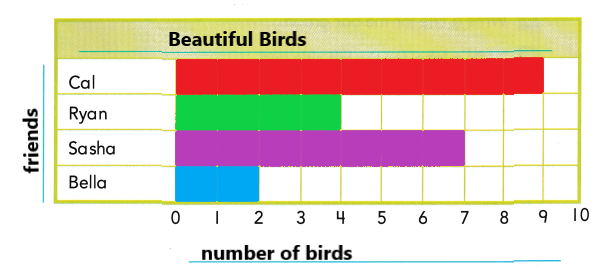
Use Structure Cal and his friends were looking for birds. Cal saw 9 birds. Ryan saw 4 birds. Sasha saw 7 birds. Bella saw 2 birds. Draw a bar graph to show the data.
Answer:
Question 3.
Reason How many birds did Ryan, Sasha, and Bella see? Explain.
Answer:
13
Explanation:
Ryan saw 4 birds, Sasha saw 7 and Bella saw 2 birds
4 + 7 + 2 = 13
Question 4.
Open Ended Risa sees 6 birds. Describe how the number of birds she sees compares to the data in the graph.
Answer:
If Risa sees 6 birds then she saw more number of birds than Bella and Ryan.
I’m in a Learning Mindset!
How could I solve Problem 3 in a different way?
_______________________________