We included HMH Into Math Grade 2 Answer Key PDF Module 3 Review to make students experts in learning maths.
HMH Into Math Grade 2 Module 3 Review Answer Key
Vocabulary
Survey
key
bar graph
Vocabulary
Write the word that completes each sentence.
Question 1.
A ________ uses bars to show information.
Answer:
A bar graph uses bars to show information.
Question 2.
In a picture graph, a _______ tells how many each picture stands for.
Answer:
In a picture graph, a key tells how many each picture stands for.
Question 3.
A _______ is a way to collect data, or information.
Answer:
A survey is a way to collect data, or information.
Concepts and Skills
Use the picture graph to solve the problems.
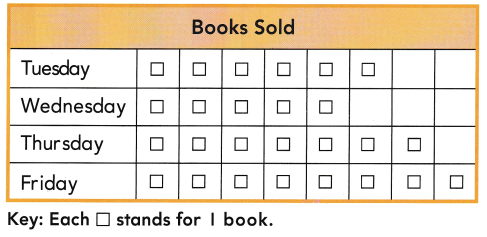
Question 4.
How many fewer books were sold on Wednesday than on Friday? ___ fewer books
Answer:
3 fewer books
Explanation:
5 books were sold on Wednesday, and 8 books on Friday
8 – 5 = 3.
Question 5.
Tasha wants to draw a tally chart to show the data in the picture graph above. If each tally mark stands for 1 book, how many tally marks will she draw to show the books sold on Thursday? ____ tally marks
Answer:
7 tally marks
Explanation:
7 books were sold on Thursday so, Tasha need to draw 7 tally marks.
Use the bar graph to solve the problems.
Fill in the bubble next to the correct answer.
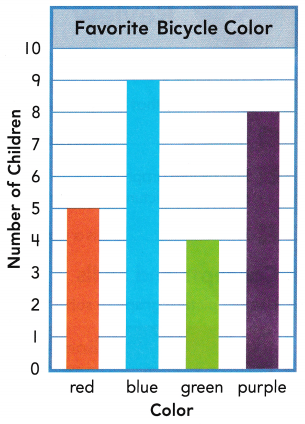
Question 6.
How many more children chose blue than red?
(A) 1
(B) 4
(C) 5
Answer:
(B) 4
Explanation:
9 chose blue, 5 chose red
9 – 5 = 4.
Question 7.
How many children chose green or red?
(A) 9
(B) 13
(C) 14
Answer:
(A) 9
Explanation:
4 chose green, 5 chose red
4 + 5 = 9.
Question 8.
Where will the bar for purple end if 1 more child chooses purple?
(A) 6
(B) 9
(C) 10
Answer:
(B) 9
Explanation:
8 chose purple, if 1 more chose then 8 + 1 = 9, the purple graph will end at 9.
Question 9.
Which bicycle colors were chosen by more than 6 children? Choose the two correct answers.
(A) blue
(B) Cred
(C) green
(D) purple
Answer:
(A) blue
Explanation:
8 > 6, 8 chose blue.