We included HMH Into Math Grade 2 Answer Key PDF Module 3 Lesson 4 Interpret Bar Graphs to make students experts in learning maths.
HMH Into Math Grade 2 Module 3 Lesson 4 Answer Key Interpret Bar Graphs
I Can read a bar graph and use it to solve problems.
Spark Your Learning
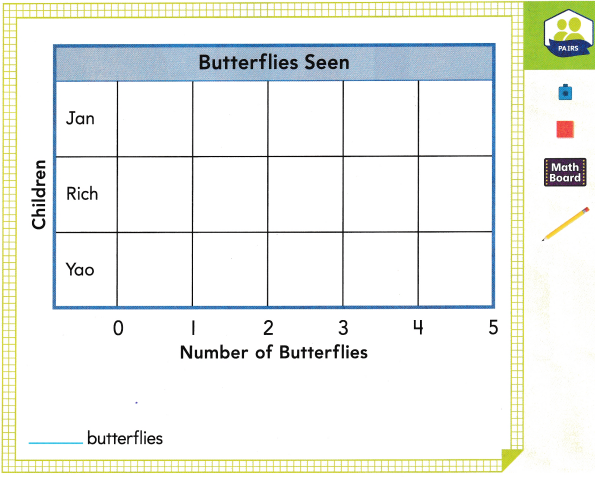
Show the butterfly data in the bar graph. How many butterflies did the children see?

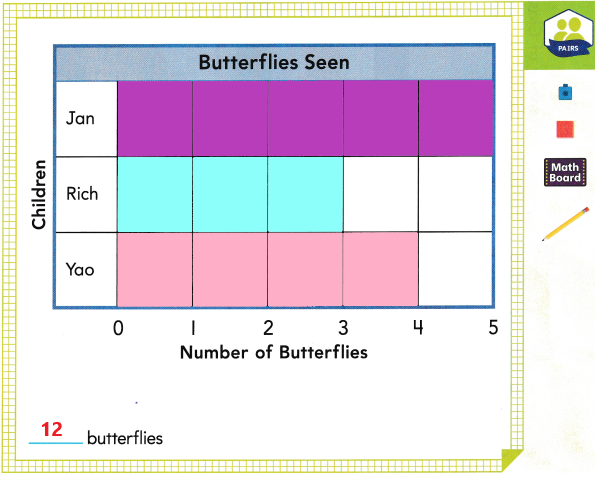
Answer:
Explanation:
Jan saw 5 butterflies, Rich saw 3 and Yao saw 4
5+ 3 + 4 = 12 butterflies.
Read the following: Jan and her friends saw some butterflies. Jan saw 5 butterflies. Rich saw 3 butterflies. Yao saw 4 butterflies. Show this data in the bar graph. Then find how many butterflies the children saw.
Build Understanding
Tyler recorded the favorite vegetable of his classmates in a bar graph.
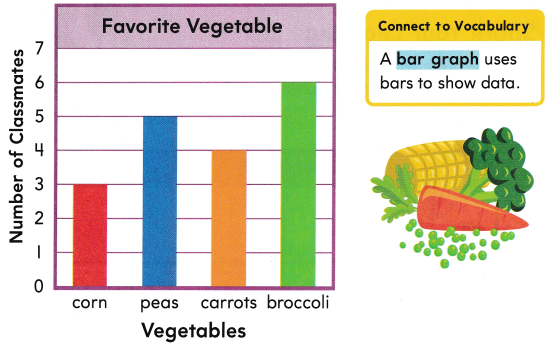
A. Which bar shows the vegetable chosen by the most classmates? Circle the answer.
the shortest bar the tallest bar

B. How can you use the data in the bar graph to solve problems?
- How many classmates chose peas or carrots? ____ classmates
Answer:
9 classmates(5 chose peas and 4 chose carrots) - How many fewer classmates chose corn than broccoli? ____ fewer classmates
Answer:
3 fewer classmates (3 chose corn , 6 chose broccoli 6-3=3)
Turn and Talk How do you tell how many a bar stands for in a bar graph?
Step It Out
1. The bar graph shows the number of soccer goals Annie and her friends scored.
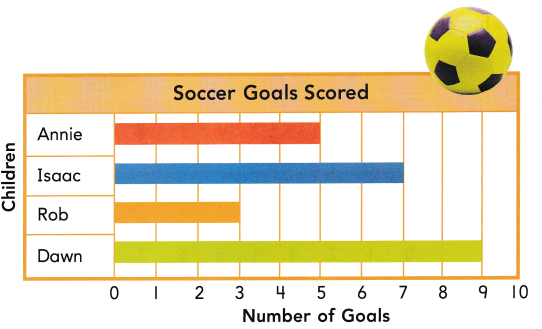
A. Look at where each bar ¡n the graph ends. Write how many goals each child scored.
Annie: ___ goals Isaac: ___ goals
Rob: ___ goals Dawn: ___ goals
Answer:
Annie: 5 goals
Isaac: 7 goals
Rob: 3 goals
Dawn: 9 goals
B. Use the data from the bar graph to solve the problem. ___ more goals
Answer:
Check Understanding
Use the bar graph above to solve the problems.
Question 1.
Who scored the fewest goals? ____
Answer:
Rob scored fewest with 3 goals.
Question 2.
How many fewer goals did Rob score than Isaac? ___ fewer goals
Answer:
4 fewer goals rob scored than Issac.
Explanation:
Isaac: 7 goals
Rob: 3 goals
7 – 3 = 4
On Your Own
Use the bar graph to solve the problems.
Question 3.
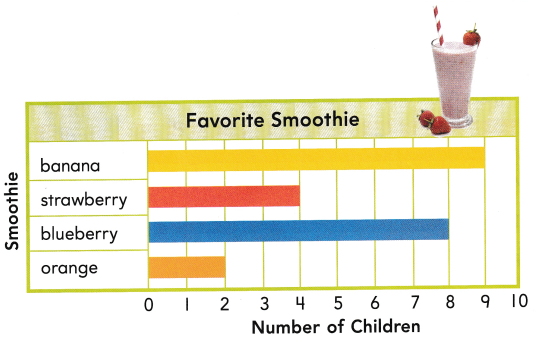
Attend to Precision How many children chose strawberry or blueberry smoothies? ___ children
Answer:
4 children
Question 4.
How many more children chose banana than orange smoothies? ____ more children
Answer:
7 more children chose banana than orange smoothies.
Explanation:
9 chose banana, 2 scored orange
9 – 2 = 7
Question 5.
Reason Two children change their favorite smoothie from banana to orange. Now how many children choose orange? ___ children
Answer:
4 chose orange smoothie now.
Explanation:
2 chose orange, if 2 more change from banana to orange then 2 + 2 = 4.
Question 6.
Open Ended Write a new question that you could answer using the graph. Then solve.
Answer:
How many children chose blueberry smoothie?
Answer:
8 children.
I’m in a Learning Mindset!
What makes me curious about using a bar graph to solve problems?
________________________________________