Engage NY Eureka Math 7th Grade Module 1 Lesson 10 Answer Key
Eureka Math Grade 7 Module 1 Lesson 10 Example Answer Key
Example 1.
Grandma’s special chocolate chip cookie recipe, which yields 4 dozen cookies, calls for 3 cups of flour. Using this information, complete the chart:
Create a table comparing the amount of flour used to the amount of cookies.
Answer:
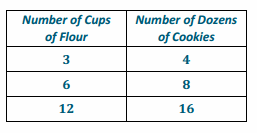
Is the number of cookies proportional to the amount of flour used? Explain why or why not.
Answer:
Yes, because there exists a constant, \(\frac{4}{3}\) or 1\(\frac{1}{3}\), such that each measure of the cups of flour multiplied by the constant gives the corresponding measure of cookies.
What is the unit rate of cookies to flour (\(\frac{y}{x}\)), and what is the meaning in the context of the problem?
Answer:
1\(\frac{1}{3}\)
1\(\frac{1}{3}\) dozen cookies, or 16 cookies for 1 cup of flour
Model the relationship on a graph.
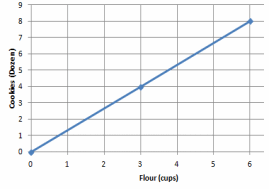
Does the graph show the two quantities being proportional to each other? Explain.
Answer:
The points appear on a line that passes through the origin (0,0).
Write an equation that can be used to represent the relationship.
Answer:
D = 1\(\frac{1}{3}\)F, D = 1.\(\overline{3}\)F, or
D = \(\frac{4}{3}\)F
D represents the number of dozens of cookies.
F represents the number of cups of flour.
Example 2.
Below is a graph modeling the amount of sugar required to make Grandma’s special chocolate chip cookies.
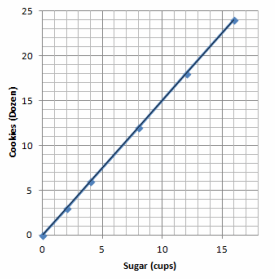
a. Record the coordinates from the graph. What do these ordered pairs represent?
Answer:
(0,0); 0 cups of sugar will result in 0 dozen cookies.
(2,3); 2 cups of sugar yield 3 dozen cookies.
(4,6); 4 cups of sugar yield 6 dozen cookies.
(8,12); 8 cups of sugar yield 12 dozen cookies.
(12,18); 12 cups of sugar yield 18 dozen cookies.
(16,24); 16 cups of sugar yield 24 dozen cookies.
b. Grandma has 1 remaining cup of sugar. How many dozen cookies will she be able to make? Plot the point on the graph above.
Answer:
1.5 dozen cookies
c. How many dozen cookies can Grandma make if she has no sugar? Can you graph this on the coordinate plane provided above? What do we call this point?
Answer:
(0,0); 0 cups of sugar will result in 0 dozen cookies. The point is called the origin.
Eureka Math Grade 7 Module 1 Lesson 10 Exercise Answer Key
Question 1.
The graph below shows the amount of time a person can shower with a certain amount of water.
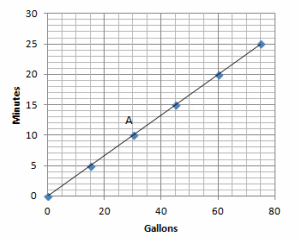
a. Can you determine by looking at the graph whether the length of the shower is proportional to the number of gallons of water? Explain how you know.
Answer:
Yes, the quantities are proportional to each other since all points lie on a line that passes through the origin (0,0).
b. How long can a person shower with 15 gallons of water? How long can a person shower with 60 gallons of water?
Answer:
5 minutes; 20 minutes
c. What are the coordinates of point A? Describe point A in the context of the problem.
Answer:
(30,10). If there are 30 gallons of water, then a person can shower for 10 minutes.
d. Can you use the graph to identify the unit rate?
Answer:
Since the graph is a line that passes through (0,0) and (1,r), you can take a point on the graph, such as (15,5) and get \(\frac{1}{3}\).
e. Write the equation to represent the relationship between the number of gallons of water used and the length of a shower.
m = \(\frac{1}{3}\)g, where m represents the number of minutes, and g represents the number of gallons of water.
Question 2.
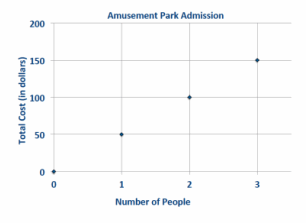
Your friend uses the equation C = 50P to find the total cost, C, for the number of people, P, entering a local amusement park.
a. Create a table and record the cost of entering the amusement park for several different-sized groups of people.
Answer:

b. Is the cost of admission proportional to the amount of people entering the amusement park? Explain why or why not.
Answer:
Yes. The cost of admission is proportional to the amount of people entering the amusement park because there exists a constant (50), such that each measure of the amount of people multiplied by the constant gives the corresponding measures of cost.
c. What is the unit rate, and what does it represent in the context of the situation?
Answer:
50; 1 person costs $50.
d. Sketch a graph to represent this relationship.
Answer:
e. What points must be on the graph of the line if the two quantities represented are proportional to each other? Explain why, and describe these points in the context of the problem.
Answer:
(0, 0) and (1, 50). If 0 people enter the park, then the cost would be $0. If 1 person enters the park, the cost would be $50. For every 1-unit increase along the horizontal axis, the change in the vertical distance is 50 units.
f. Would the point (5, 250) be on the graph? What does this point represent in the context of the situation?
Answer:
Yes, the point (5, 250) would be on the graph because 5(50) = 250. The meaning is that it would cost a total of $250 for 5 people to enter the amusement park.
Eureka Math Grade 7 Module 1 Lesson 10 Problem Set Answer Key
Question 1.
The graph to the right shows the relationship of the amount of time (in seconds) to the distance (in feet) run by a jaguar.
a. What does the point (5, 290) represent in the context of the situation?
Answer:
In 5 seconds, a jaguar can run 290 feet.
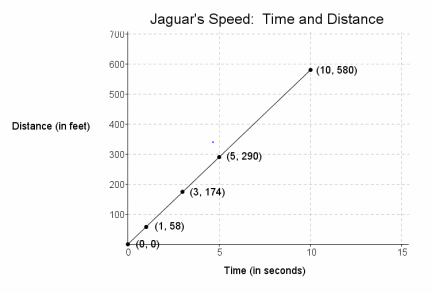
b. What does the point (3, 174) represent in the context of the situation?
Answer:
A jaguar can run 174 feet in 3 seconds.
c. Is the distance run by the jaguar proportional to the time? Explain why or why not.
Answer:
Yes, the distance run by the jaguar is proportional to the time spent running because the graph shows a line that passes through the origin (0,0).
d. Write an equation to represent the distance run by the jaguar. Explain or model your reasoning.
Answer:
y = 58x
The constant of proportionality, or unit rate of \(\frac{y}{x}\), is 58 and can be substituted into the equation y = kx in place of k.
Question 2.
Championship t-shirts sell for $22 each.
a. What point(s) must be on the graph for the quantities to be proportional to each other?
Answer:
(0,0),(1,22)
b. What does the ordered pair (5,110) represent in the context of this problem?
Answer:
5 t-shirts will cost $110.
c. How many t-shirts were sold if you spent a total of $88?
Answer:
4; \(\frac{88}{22}\) = 4
Question 3.
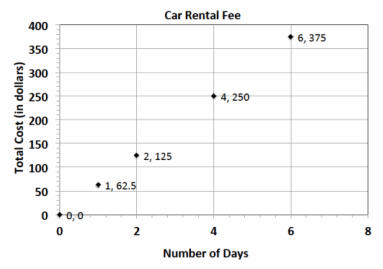
The graph represents the total cost of renting a car. The cost of renting a car is a fixed amount each day, regardless of how many miles the car is driven.
a. What does the ordered pair (4, 250) represent?
Answer:
It would cost $250 to rent a car for 4 days.
b. What would be the cost to rent the car for a week? Explain or model your reasoning.
Answer:
Since the unit rate is 62.5, the cost for a week would be 62.5(7)=$437.50.
Question 4.
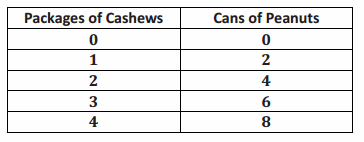
Jackie is making a snack mix for a party. She is using cashews and peanuts. The table below shows the relationship of the number of packages of cashews she needs to the number of cans of peanuts she needs to make the mix.
a. Write an equation to represent this relationship.
Answer:
y = 2x, where x represents the number of packages of cashews, and y represents the number of cans of peanuts.
b. Describe the ordered pair (12,24) in the context of the problem.
Answer:
In the mixture, you will need 12 packages of cashews and 24 cans of peanuts.
Question 5.
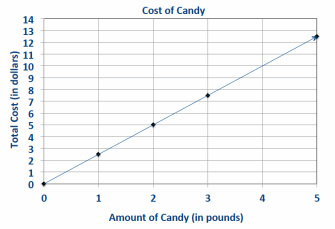
The following table shows the amount of candy and price paid.

a. Is the cost of the candy proportional to the amount of candy?
Answer:
Yes, because there exists a constant, 2.5, such that each measure of the amount of candy multiplied by the constant gives the corresponding measure of cost.
b. Write an equation to illustrate the relationship between the amount of candy and the cost.
Answer:
y = 2.5x
c. Using the equation, predict how much it will cost for 12 pounds of candy.
Answer:
2.5(12)=$30
d. What is the maximum amount of candy you can buy with $60?
Answer:
\(\frac{60}{2.5}\) = 24 pounds
e. Graph the relationship
Eureka Math Grade 7 Module 1 Lesson 10 Exit Ticket Answer Key
Great Rapids White Water Rafting Company rents rafts for $125 per hour. Explain why the point (0, 0) and (1, 125) are on the graph of the relationship and what these points mean in the context of the problem.
Answer:
Every graph of a proportional relationship must include the points (0,0) and (1,r). The point (0,0) is on the graph because 0 can be multiplied by the constant to determine the corresponding value of 0. The point (1,125) is on the graph because 125 is the unit rate. On the graph, for every 1 unit change on the horizontal axis, the vertical axis will change by 125 units. The point (0, 0) means 0 hours of renting a raft would cost $0, and (1, 125) means 1 hour of renting the raft would cost $125.