Engage NY Eureka Math 7th Grade Module 1 Lesson 15 Answer Key
Eureka Math Grade 7 Module 1 Lesson 15 Example Answer Key
Example 1.
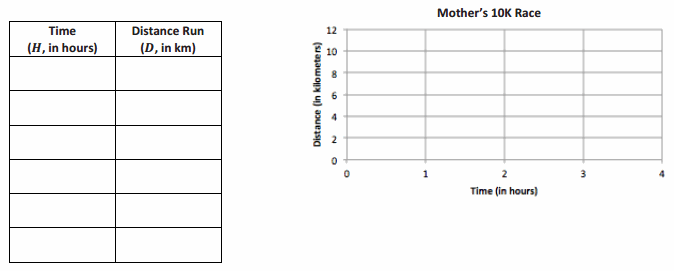
Mother’s 10K Race
Sam’s mother has entered a 10K race. Sam and his family want to show their support for their mother, but they need to figure out where they should go along the race course. They also need to determine how long it will take her to run the race so that they will know when to meet her at the finish line. Previously, his mother ran a 5K race with a time of 1\(\frac{1}{2}\) hours. Assume Sam’s mother will run the same rate as the previous race in order to complete the chart.
→ Discuss with your partner: Can you find Sam’s mother’s average rate for the entire race based on her previous race time?
→ 3\(\frac{1}{3}\) km/h, or \(\frac{10}{3}\) km/h
Create a table that shows how far Sam’s mother has run after each half hour from the start of the race, and graph it on the coordinate plane to the right.
Answer:
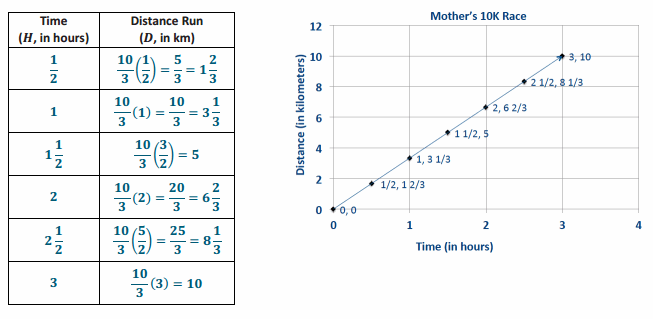
a. What are some specific things you notice about this graph?
Answer:
It forms a line through the origin; it relates time (in hours) to the distance run (in kilometers); the line through the origin means that the values are proportional.
b. What is the connection between the table and the graph?
Answer:
The time (in hours) is on the horizontal axis, and the distance run (in kilometers) is on the vertical axis; the coordinates of the points on the line are the same as the pairs of numbers in the table.
c. What does the point (2, 6\(\frac{2}{3}\) ) represent in the context of this problem?
Answer:
After 2 hours, she has run 6 \(\frac{2}{3}\) km.
Discuss the responses with the class and draw a conclusion.
→ Write an equation that models the data in the chart. Record the student responses so that they can see all of the responses.
→ D = 3\(\frac{1}{3}\) H, where D represents the distance, and H represents the hours (or D=\(\frac{10}{3}\) H).
Example 2.
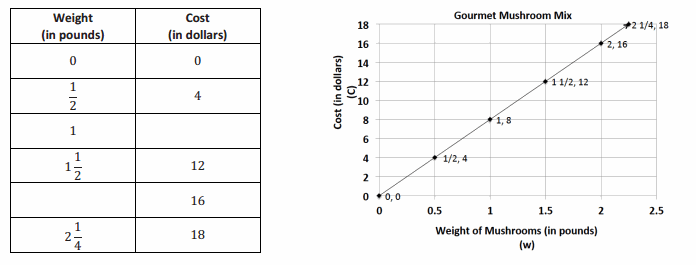
Gourmet Cooking
After taking a cooking class, you decide to try out your new cooking skills by preparing a meal for your family. You have chosen a recipe that uses gourmet mushrooms as the main ingredient. Using the graph below, complete the table of values and answer the following questions.
Answer:
a. Is this relationship proportional? How do you know from examining the graph?
Answer:
Yes, the relationship is proportional because the graph is a line that passes through the origin.
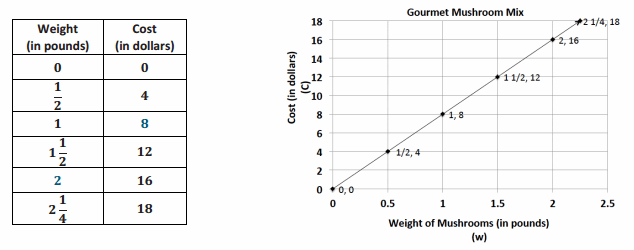
b. What is the unit rate for cost per pound?
Answer:
k = \(\frac{16}{2}\) = 8. The unit rate is 8.
c. Write an equation to model this data.
Answer:
C = 8w
d. What ordered pair represents the unit rate, and what does it mean?
Answer:
(1, 8) The unit rate is 8, which means that one pound of mushrooms costs $8.00.
e. What does the ordered pair (2, 16) mean in the context of this problem?
Answer:
(2, 16) This means 2 pounds of mushrooms cost $16.00.
f. If you could spend $10.00 on mushrooms, how many pounds could you buy?
Answer:
C = 8w; C = 10;(\(\frac{1}{8}\) )10 = (\(\frac{1}{8}\) )8w; 1 \(\frac{1}{4}\) = w. You can buy 1.25 pounds of mushrooms with $10.00.
g. What would be the cost of 30 pounds of mushrooms?
Answer:
C = 8w; w = 30; C = 8(30); C = $240
Eureka Math Grade 7 Module 1 Lesson 15 Problem Set Answer Key
Question 1.
Students are responsible for providing snacks and drinks for the Junior Beta Club Induction Reception. Susan and Myra were asked to provide the punch for the 100 students and family members who will attend the event. The chart below will help Susan and Myra determine the proportion of cranberry juice to sparkling water needed to make the punch. Complete the chart, graph the data, and write the equation that models this proportional relationship.
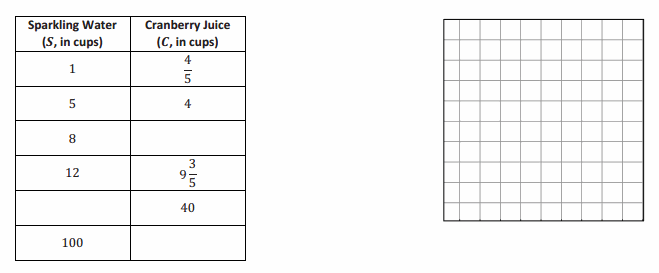
Answer:
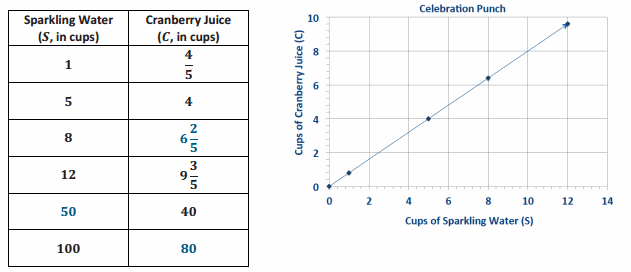
C = \(\frac{4}{5}\) S, where C represents the number of cups of cranberry juice, and S represents the number of cups of sparkling water.
Question 2.
Jenny is a member of a summer swim team.
a. Using the graph, determine how many calories she burns in one minute.
Answer:
Jenny burns 100 calories every 15 minutes, so she burns 6 \(\frac{2}{3}\) calories each minute.
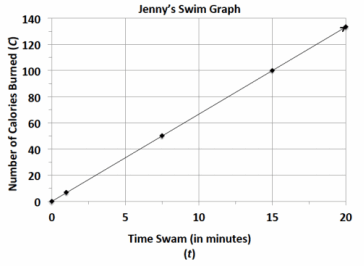
b. Use the graph to determine the equation that models the number of calories Jenny burns within a certain number of minutes.
Answer:
C = 6 \(\frac{2}{3}\) t, where C represents the number of calories burned, and t represents the time she swims in minutes.
c. How long will it take her to burn off a 480-calorie smoothie that she had for breakfast?
Answer:
It will take Jenny 72 minutes of swimming to burn off the smoothie she had for breakfast.
Question 3.
Students in a world geography class want to determine the distances between cities in Europe. The map gives all distances in kilometers. The students want to determine the number of miles between towns so they can compare distances with a unit of measure with which they are already familiar. The graph below shows the relationship between a given number of kilometers and the corresponding number of miles.
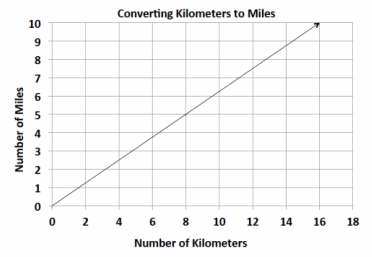
a. Find the constant of proportionality, or the rate of miles per kilometer, for this problem, and write the equation that models this relationship.
Answer:
The constant of proportionality is \(\frac{5}{8}\) .
The equation that models this situation is M=\(\frac{5}{8}\) K, where M represents the number of miles, and K represents the number of kilometers.
b. What is the distance in kilometers between towns that are 5 miles apart?
Answer:
The distance between towns that are 5 miles apart is 8 km.
c. Describe the steps you would take to determine the distance in miles between two towns that are 200 kilometers apart?
Answer:
Solve the equation M = \(\frac{5}{8}\) (200). To find the number of miles for 200 km, multiply 200 by \(\frac{5}{8}\).
200(\(\frac{5}{8}\)) = 125. The two towns are 125 miles apart.
Question 4.
During summer vacation, Lydie spent time with her grandmother picking blackberries. They decided to make blackberry jam for their family. Her grandmother said that you must cook the berries until they become juice and then combine the juice with the other ingredients to make the jam.
a. Use the table below to determine the constant of proportionality of cups of juice to cups of blackberries.
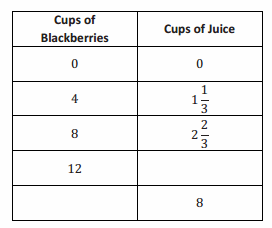
Answer:
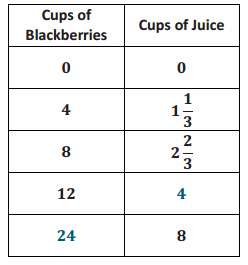
k = \(\frac{1}{3}\) one cup of juice is produced when 3 cups of blackberries are cooked.
b. Write an equation that models the relationship between the number of cups of blackberries and the number of cups of juice.
Answer:
j = \(\frac{1}{3}\) b, where j represents the number of cups of juice, and b represents the number of cups of blackberries.
c. How many cups of juice were made from 12 cups of berries? How many cups of berries are needed to make 8 cups of juice?
Answer:
4 cups of juice are made from 12 cups of berries.
24 cups of berries are needed to make 8 cups of juice.
Eureka Math Grade 7 Module 1 Lesson 15 Exit Ticket Answer Key
Using the graph and its title:
Question 1.
Describe the relationship that the graph depicts.
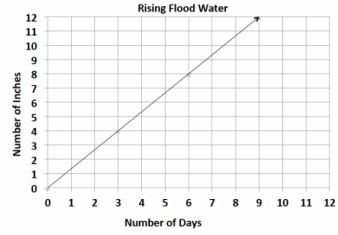
Answer:
The graph shows that in 3 days the water rose to 4 inches. The water has risen at a constant rate. Therefore, the water has risen 1 \(\frac{1}{3}\) inches per day.
Question 2.
Identify two points on the line, and explain what they mean in the context of the problem.
Answer:
(6, 8) means that by the 6th day, the water rose 8 inches; (9, 12) means that by the 9th day, the water rose 12 inches.
Question 3.
What is the unit rate?
Answer:
The unit rate in inches per day is \(\frac{4}{3}\) .
Question 4.
What point represents the unit rate?
Answer:
The point that shows the unit rate is (1, 1 \(\frac{1}{3}\)).