Engage NY Eureka Math 7th Grade Module 1 Lesson 6 Answer Key
Eureka Math Grade 7 Module 1 Lesson 6 Poster Layout Answer Key
Take notes and answer the following questions:
- Were there any differences found in groups that had the same ratios?
- Did you notice any common mistakes? How might they be fixed?
- Were there any groups that stood out by representing their problem and findings exceptionally clearly?
Poster 1:
Poster 2:
Poster 3:
Poster 4:
Poster 5:
Poster 6:
Poster 7:
Poster 8:
Note about Lesson Summary:
Answer:
Group 1 to 8
Problem:
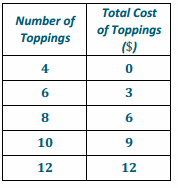
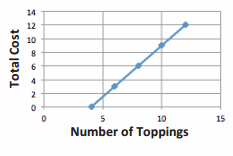
A local frozen yogurt shop is known for their monster sundaes. Create a table, and then graph and explain if the quantities are proportional to each other.
Table:
Graph:
Explanation:
Although the points appear on a line, the quantities are not proportional to each other because the line does not go through the origin. Each topping does not have the same unit cost.
Group 2 and 7
Problem:
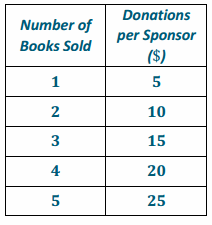
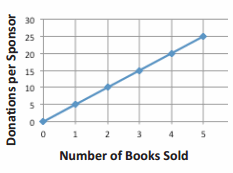
The school library receives money for every book sold at the school’s book fair. Create a table, and then graph and explain if the quantities are proportional to each other.
Table:
Graph:
Explanation:
The quantities are proportional to each other because the points appear on a line that goes through the origin. Each book sold brings in $5.00, no matter how many books are sold.
Group 3 and 6
Problem:
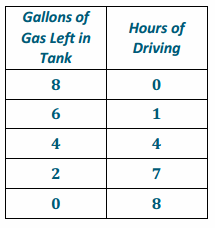
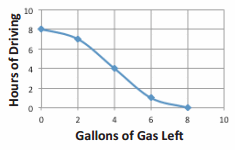
Your uncle just bought a hybrid car and wants to take you and your siblings camping. Create a table, and then graph and explain if the quantities are proportional to each other.
Table:
Graph:
Explanation:
The graph is not represented by a line passing through the origin, so the quantities are not proportional to each other. The number of gallons of gas varies depending on how fast or slow the car is driven.
Group 4 and 5
Problem:
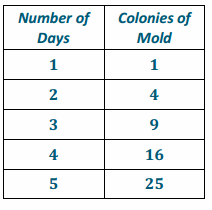
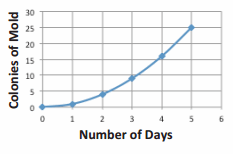
For a science project, Eli decided to study colonies of mold. He observed a piece of bread that was molding. Create a table, and then graph and explain if the quantities are proportional to each other.
Table:
Graph:
Explanation:
Although the graph looks as though it goes through the origin, the quantities are not proportional to each other because the points do not appear on a line. Each day does not produce the same amount of colonies as the other days.
Eureka Math Grade 7 Module 1 Lesson 6 Problem Set Answer Key
Problem:
Sally’s aunt put money in a savings account for her on the day Sally was born. The savings account pays interest for keeping her money in the bank. The ratios below represent the number of years to the amount of money in the savings account.
- After one year, the interest accumulated, and the total in Sally’s account was $312.
- After three years, the total was $340. After six years, the total was $380.
- After nine years, the total was $430. After 12 years, the total amount in Sally’s savings account was $480.
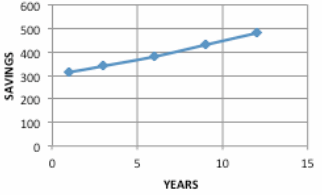
Using the same four-fold method from class, create a table and a graph, and explain whether the amount of money accumulated and the time elapsed are proportional to each other. Use your table and graph to support your reasoning.
Graph:
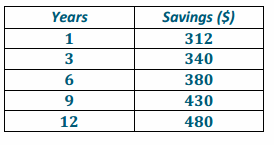
Table:
Explanation:
The graph is not a graph of a proportional relationship because, although the data appears to be a line, it is not a line that goes through the origin. The amount of interest collected is not the same every year.
Eureka Math Grade 7 Module 1 Lesson 6 Exit Ticket Answer Key
Question 1.
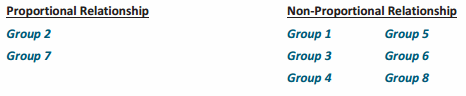
Which graphs in the art gallery walk represented proportional relationships, and which did not? List the group number.
![]()
Answer:
Question 2.
What are the characteristics of the graphs that represent proportional relationships?
Answer:
Graphs of groups 2 and 7 appear on a line and go through the origin.
Question 3.
For the graphs representing proportional relationships, what does (0,0) mean in the context of the situation?
Answer:
For zero books sold, the library received zero dollars in donations.