Engage NY Eureka Math Algebra 1 Module 2 Lesson 3 Answer Key
Eureka Math Algebra 1 Module 2 Lesson 3 Exercise Answer Key
Exercises 1–7
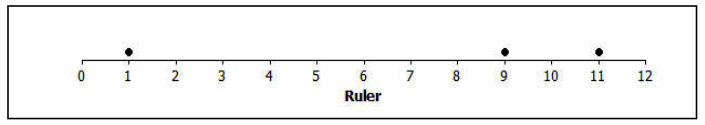
Consider the following example of quarters taped to a lightweight ruler.
Exercise 1.
Sam taped 3 quarters to his ruler. The quarters were taped to the positions 1 inch, 9 inches, and 11 inches. If the pencil was placed under the position 5 inches, do you think the ruler would balance? Why or why not?
Answer:
5 would not be the position of balance. The quarters at 9 and 11 pull the balance point toward that side.
Exercise 2.
If the ruler did not balance, would you move the pencil to the left or to the right of 5 inches to balance the ruler? Explain your answer.
Answer:
I would move the position to the right because the quarters at position 9 and 11 pull the balance point to that side.
Exercise 3.
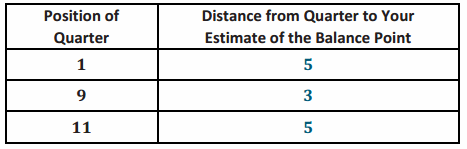
Estimate a balance point for the ruler. Complete the following based on the position you selected.
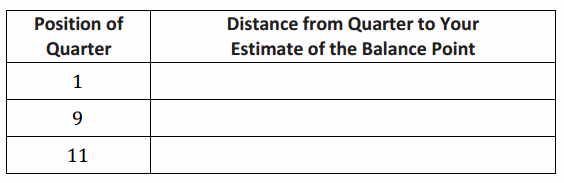
Answer:
Answers will vary. Allow students to describe distance as a signed number. The following table is based upon a balance point of 6 inches.
Exercise 4.
What is the sum of the distances to the right of your estimate of the balance point?
Answer:
Answers will vary. Using a balance point of 6 inches, the sum to the right is 8 units.
Exercise 5.
What is the sum of the distances to the left of your estimate of the balance point?
Answer:
Using a balance point of 6 inches, the sum to the left is 5 units.
Exercise 6.
Do you need to adjust the position of your balance point? If yes, explain how.
Answer:
Using a balance point of 6 inches, an adjustment is needed. The balance point is found by increasing the distances to the left and decreasing the distances to the right.
Exercise 7.
Calculate the mean and the median of the position of the quarters. Does the mean or the median of the positions provide a better estimate of the balance point for the position of the 3 quarters taped to this ruler? Explain why you made this selection.
Answer:
The mean of the positions is 7 inches, and the median is 9 inches. The mean provides a better estimate of the balance point. If the mean position of 7 was selected, then the distance of the quarter to the left of 7 would be 6, and the sum of the distances of the two quarters to the right of 7 would be 2+4, or 6. The balance point is the position in which the sum of the distances to the right and to the left are equal. If the median position of 9 was selected, then the distance to the left would be 8, and the distance to the right would be 2. Clearly, that would not balance the 3 quarters on the ruler.
Exercises 8–20
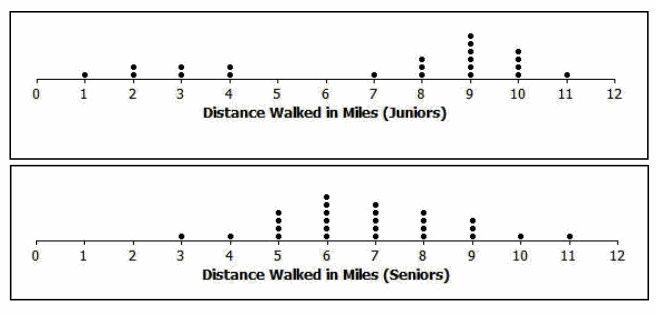
Twenty-two students from the junior class and twenty-six students from the senior class at River City High School participated in a walkathon to raise money for the school’s band. Dot plots indicating the distances in miles students from each class walked are as follows.
Exercise 8.
Estimate the mean number of miles walked by a junior, and mark it with an X on the junior class dot plot. How did you estimate this position?
Answer:
Answers will vary. Some students may take into account the skewed shape of the distribution. Others may put the mean in the middle of the number line. Listen to students as they make their estimates.
Exercise 9.
What is the median of the junior data distribution?
Answer:
The median is 8.5. (It is halfway between the eleventh and twelfth person.)
Exercise 10.
Is the mean number of miles walked by a junior less than, approximately equal to, or greater than the median number of miles? If they are different, explain why. If they are approximately the same, explain why.
Answer:
The mean is less than the median. The small cluster of data values to the left pulls the mean in that direction. The median is not affected by the values of those points.
Exercise 11.
How would you describe the typical number of miles walked by a junior in this walkathon?
Answer:
The mean appears to underestimate the distance walked by a junior. Only eight students walked less than the mean, while fourteen students walked more. (Answers may vary. Since students are estimating, they may say seven students walked less than the mean.) The median is a better description of a typical value.
Exercise 12.
Estimate the mean number of miles walked by a senior, and mark it with an X on the senior class dot plot. How did you estimate this position?
Answer:
The distribution appears to be symmetric, around 6 or 7. The balance point should be in the middle of the distribution.
Exercise 13.
What is the median of the senior data distribution?
Answer:
The median is 7 miles.
Exercise 14.
Estimate the mean and the median of the miles walked by the seniors. Is your estimate of the mean number of miles less than, approximately equal to, or greater than the median number of miles walked by a senior? If they are different, explain why. If they are approximately the same, explain why.
Answer:
Since the distribution is symmetric, the mean and median are approximately equal. A good estimate for both is around 7 miles.
Exercise 15.
How would you describe the typical number of miles walked by a senior in this walkathon?
Answer:
A typical number of miles walked by a senior would be around 7 miles.
Exercise 16.
A junior from River City High School indicated that the number of miles walked by a typical junior was better than the number of miles walked by a typical senior. Do you agree? Explain your answer.
Answer:
Yes. The median is a better indicator of a typical value for the junior class. The median of the junior class is more than the median of the senior class.
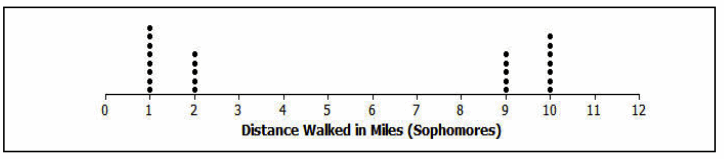
Finally, the twenty-five sophomores who participated in the walkathon reported their results. A dot plot is shown below.
Exercise 17.
What is different about the sophomore data distribution compared to the data distributions for juniors and seniors?
Answer:
It is a U-shaped distribution. Half of the sophomores walk on the low end and half on the high end. The juniors had a skewed distribution, and the seniors had a symmetric distribution.
Exercise 18.
Estimate the balance point of the sophomore data distribution.
Answer:
An estimate of the mean is 5.
Exercise 19.
What is the median number of miles walked by a sophomore?
Answer:
Since there are 25 values, the median is the thirteenth value from the right or left. The median is 2.
Exercise 20.
How would you describe the sophomore data distribution?
Answer:
It is a U-shaped distribution. The values are either small or large. The mean and median are not good indicators of a typical distance for sophomores.
Eureka Math Algebra 1 Module 2 Lesson 3 Exit Ticket Answer Key
Question 1.
Draw a dot plot of a data distribution representing the ages of twenty people for which the median and the mean would be approximately the same.
Answer:
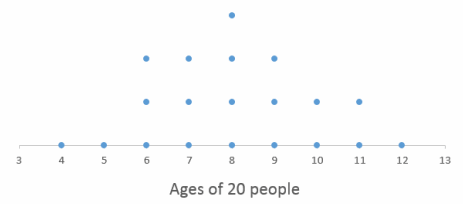
A dot plot representing a symmetrical distribution is an example in which the mean and median are approximately the same.
Question 2.
Draw a dot plot of a data distribution representing the ages of twenty people for which the median is noticeably less than the mean.
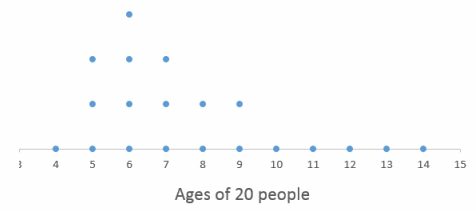
Answer:
A dot plot representing a skewed data distribution in which most of the values are located farther to the left results in a median value less than the mean.
Question 3.
An estimate of the balance point for a distribution of ages represented on a number line resulted in a greater sum of the distances to the right than the sum of the distances to the left. In which direction should you move your estimate of the balance point? Explain.
Answer:
Moving the position to the right would result in decreasing the sum of the distances to the right and increasing the sum of the distances to the left. The position where they are equal is the mean.
Eureka Math Algebra 1 Module 2 Lesson 3 Problem Set Answer Key
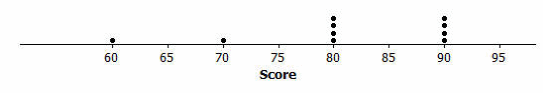
Consider another example of balance. Mr. Jackson is a mathematics teacher at Waldo High School. Students in his class are frequently given quizzes or exams. He indicated to his students that an exam is worth 4 quizzes when calculating an overall weighted average to determine their final grade. During one grading period, Scott got an 80% on one exam, a 90% on a second exam, a 60% on one quiz, and a 70% on another quiz.
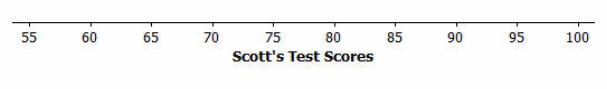
How could we represent Scott’s test scores? Consider the following number line.
Question 1.
What values are represented by the number line?
Answer:
The values represented along the number line are percents.
Question 2.
If one “•” symbol is used to represent a quiz score, how might you represent an exam score?
Answer:
Since an exam is worth 4 quizzes, students could use a stack of 4 of the “•” symbols to represent an exam score.
Question 3.
Represent Scott’s exams and quizzes on this number line using “•” symbols.
Answer:
The following dot plot could be used to represent Scott’s scores:
Question 4.
Mr. Jackson indicated that students should set an 85% overall weighted average as a goal. Do you think Scott met that goal? Explain your answer.
Answer:
Students’ responses may vary. The overall weighted average could be represented by the balance point for the dot plot. The balance point is approximately 81% and is less than the goal set by Mr. Jackson.
Question 5.
Place an X on the number line at a position that you think locates the balance point of all of the “•” symbols. Determine the sum of the distances from the X to each “•” on the right side of the X.
Answer:
Answers depend on a student’s estimate of the balance point. If students placed their estimate close to the mean, the sum of the distances on the right side of their estimate would be approximately the same as the sum of the distances on the left side.
Question 6.
Determine the sum of the distances from the X to each “•” on the left side of the X.
Answer:
Answers depend on a student’s estimate of the balance point. If students placed their estimate close to the mean, the sum of the distances on the right side of their estimate would be approximately the same as the sum of the distances on the left side.
Question 7.
Do the total distances to the right of the X equal the total distances to the left of the X?
Answer:
Answers depend on students’ estimates.
Question 8.
Based on your answer to Problem 7, would you change your estimate of the balance point? If yes, where would you place your adjusted balance point? How does using this adjusted estimate change the total distances to the right of your estimate and the total distances to the left?
Answer:
Changes in the position would be based on whether or not the sum of the distances on the right equals the sum of the distances on the left. Students would adjust their estimate by moving the position of their balance point to equalize the sums of the distances.
\(\frac{(60+70+(4 \cdot 80)+(4 \cdot 90))}{10}\) = 81
Question 9.
Scott’s weighted average is 81. Recall that each exam score is equal to 4 times a quiz score. Show the calculations that lead to this weighted average.
Answer:
A weighted average of 81 would be based on multiplying each exam score by 4 (representing that an exam score is worth 4 times a quiz score). For this problem, the weighted average is
((60+70+(4∙80)+(4∙90)))/10=81″.”
Question 10.
How does the calculated mean score compare with your estimated balance point?
Answer:
Answers may vary. This question asks students to compare their estimates to the weighted average.
Question 11.
Compute the total distances to the right of the mean and the total distances to the left of the mean. What do you observe?
Answer:
The weighted average, like the mean discussed earlier, is a balance point. After each exam is represented by 4 “•” symbols (where each “•” represents the same weight), the result is 10 “•” symbols, which determines the mean or weighted average of Scott’s test scores. The sum of the distances to the right of the balance point is equal to the sum of the distances to the left of the balance point. If a student estimated 81% as the balance point, then:
The sum of the distances to the right:
4∙|90-81|=4∙|9|=36
The sum of the distances to the left:
|60-81|+|70-81|+4∙|80-81|=21+11+4=36
Therefore, for estimates of a balance point that is less than or greater than 81%, the distances are not equal.
Question 12.
Did Scott achieve the goal set by Mr. Jackson of an 85% average? Explain your answer.
Answer:
Scott did not achieve Mr. Jackson’s goal since his average is 81%.