Engage NY Eureka Math Algebra 1 Module 2 Lesson 4 Answer Key
Eureka Math Algebra 1 Module 2 Lesson 4 Exercise Answer Key
Discuss Exercises 1–4 as a class.
Exercises 1–4
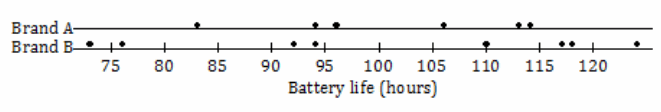
A consumers’ organization is planning a study of the various brands of batteries that are available. As part of its planning, it measures lifetime (i.e., how long a battery can be used before it must be replaced) for each of six batteries of Brand A and eight batteries of Brand B. Dot plots showing the battery lives for each brand are shown below.
Exercise 1.
Does one brand of battery tend to last longer, or are they roughly the same? What calculations could you do in order to compare the battery lives of the two brands?
Answer:
It should be clear from the dot plot that the two brands are roughly the same in terms of expected battery life. One way of making this comparison would be to calculate the means for the two brands. The means are 101 hours for Brand A and 100.5 hours for Brand B, so there is very little difference between the two.
Exercise 2.
Do the battery lives tend to differ more from battery to battery for Brand A or for Brand B?
The dot plot shows that the variability in battery life is greater for Brand B than for Brand A.
Exercise 3.
Would you prefer a battery brand that has battery lives that do not vary much from battery to battery? Why or why not?
Answer:
We prefer a brand with small variability in lifespan because these batteries will be more consistent and more predictable.
→ What would I mean by “variability” in the set of battery lives? How could I measure it?
Allow students to discuss ideas. Perhaps some come up with a general idea of the differences between the mean and the values. Perhaps some students notice the term deviation from the mean in the table that follows the questions just completed. If not:
→ Notice that in the next table in your packet (Brand A), the second row says “Deviation from the Mean.” How do you suppose you might fill in this row of the table?
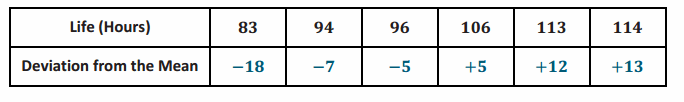
The table below shows the lives (in hours) of the Brand A batteries.
Exercise 4.
Calculate the deviations from the mean for the remaining values, and write your answers in the appropriate places in the table.
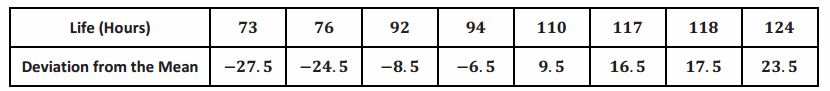
The table below shows the battery lives and the deviations from the mean for Brand B.
Guide students to conclude the following, and work a couple of examples as a group:
→ To calculate the deviations from the mean, we take each data value, x, and subtract the mean, \(\bar{x}\), from that data value. The mean for Brand A is 101 hours.
→ The deviation from the mean for the battery whose life was 114 is x-\(\bar{x}\) =114-101=13.
→ For the battery whose life was 83 hours, the deviation from the mean is 83-101=-18.
Students finish filling in the table independently (Exercise 4) and confirm answers with a neighbor.
What do you notice about the values you came up with?
→ The values that are greater than the mean have positive deviations from the mean, and the values that are less than the mean have negative deviations from the mean.
→ Notice the next table showing deviations from the mean for Brand B.
→ Ignoring the sign of the deviation, which data set tends to have larger deviations from the mean—A or B?
→ Why do you think that is?
Encourage students to summarize that the greater the variability (spread) of the distribution, the greater the deviations from the mean.
→ What do the deviations from the mean look like on the dot plot?
You could draw or project the dot plot for the Brand A batteries on the board, and students might volunteer to come to the front of the room, locate the mean on the dot plot, and show on the dot plot the distances of the points from the mean. This is an important step toward a full understanding of deviations from the mean.
After seeing the deviations from the mean for Brand B, students see that this second brand has deviations from the mean that are generally larger than those for Brand A. This comes about as a result of the fact that the distribution for Brand B has a greater spread than the distribution for Brand A.
Exercises 5–10
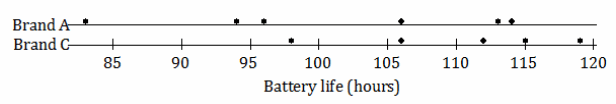
The lives of five batteries of a third brand, Brand C, were determined. The dot plot below shows the lives of the Brand A and Brand C batteries.
Exercise 5.
Which brand has the greater mean battery life? (You should be able to answer this question without doing any calculations.)
Answer:
Brand C has a greater mean battery life.
Exercise 6.
Which brand shows greater variability?
Answer:
Brand A shows greater variability.
Exercise 7.
Which brand would you expect to have the greater deviations from the mean (ignoring the signs of the deviations)?
Answer:
Brand A would have greater deviations from the mean.
The table below shows the lives for the Brand C batteries.

Exercise 8.
Calculate the mean battery life for Brand C. (Be sure to include a unit in your answer.)
Answer:
The mean battery life for Brand C is 110 hours.
Exercise 9.
Write the deviations from the mean in the empty cells of the table for Brand C.
Answer:
See table above.
Exercise 10.
Ignoring the signs, are the deviations from the mean generally larger for Brand A or for Brand C? Does your answer agree with your answer to Exercise 7?
Answer:
The deviations from the mean are generally larger for Brand A. Yes, my answer agrees with my answer to Exercise 7.
Exercises 11–15
The lives of 100 batteries of Brand D and 100 batteries of Brand E were determined. The results are summarized in the histograms below.
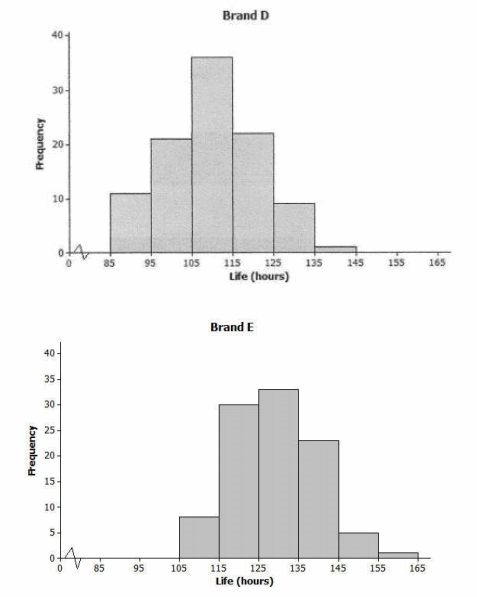
Exercise 11.
Estimate the mean battery life for Brand D. (Do not do any calculations.)
Answer:
The mean battery life is approximately 110 hours.
Exercise 12.
Estimate the mean battery life for Brand E. (Do not do any calculations.)
Answer:
The mean battery life is approximately 130 hours.
Exercise 13.
Which of Brands D and E shows the greater variability in battery lives? Do you think the two brands are roughly the same in this regard?
Answer:
The two brands are roughly the same in terms of variability.
Exercise 14.
Estimate the largest deviation from the mean for Brand D.
Answer:
The estimate for the largest value is 143 hours. So, the largest deviation is 143 hours – 110 hours, or 33 hours.
Exercise 15.
What would you consider a typical deviation from the mean for Brand D?
Answer:
Answers will vary. Sensible answers would be between 5 and 16 hours.
If there is time available, it would be useful to show students how to calculate an estimate of the mean for Brand E. See below for a histogram with the frequencies shown in parentheses.
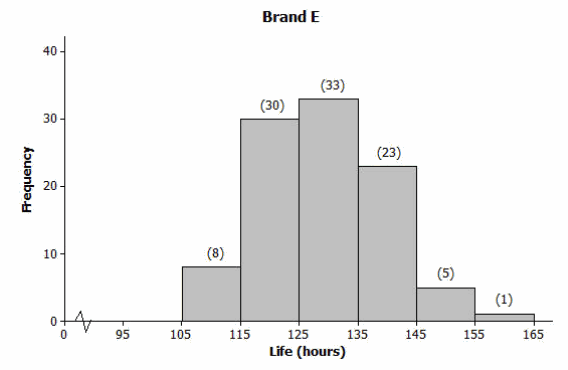
The actual lives of the batteries cannot be determined from the histogram, so we have to assume that the lives of all the batteries represented by the first block were 110 hours, the lives of all the batteries represented by the second block were 120 hours, and so on.
Making this assumption, adding up all of the battery lives gives us:
8∙110+30∙120+33∙130+23∙140+5∙150+1∙160=12900.
The total number of batteries in the study is
8+30+33+23+5+1=100.
So, our estimate of the mean battery life is \(\frac{12900 \text { hours }}{100}\)=129 hours.
It would be beneficial to ask students this focus question: When adding up the battery lives above, why did we
multiply 110 by 8, 120 by 30, and so on?
Eureka Math Algebra 1 Module 2 Lesson 4 Problem Set Answer Key
Question 1.
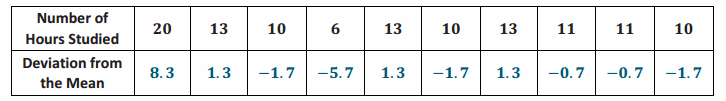
Ten members of a high school girls’ basketball team were asked how many hours they studied in a typical week. Their responses (in hours) were 20, 13, 10, 6, 13, 10, 13, 11, 11, 10.
a. Using the axis given below, draw a dot plot of these values. (Remember, when there are repeated values, stack the dots with one above the other.)

b. Calculate the mean study time for these students.
Answer:
Mean =11.7
c. Calculate the deviations from the mean for these study times, and write your answers in the appropriate places in the table below.
d. The study times for fourteen girls from the soccer team at the same school as the one above are shown in the dot plot below.
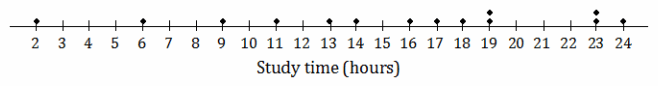
Based on the data, would the deviations from the mean (ignoring the sign of the deviations) be greater or less for the soccer players than for the basketball players?
Answer:
The spread of the distribution of study times for the soccer players is greater than that for the basketball players. So, the deviations from the mean would be greater for the soccer players than for the basketball players.
Question 2.
All the members of a high school softball team were asked how many hours they studied in a typical week.
The results are shown in the histogram below.
(The data set in this question comes from NCTM Core Math Tools,
http://www.nctm.org/Classroom-Resources/Core-Math-Tools/Data-Sets/)
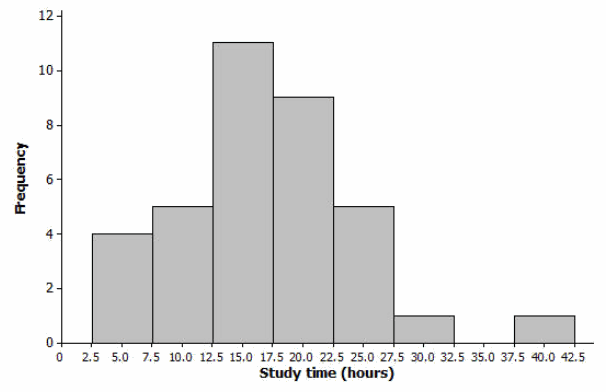
a. We can see from the histogram that four students studied around 5 hours per week. How many students studied around 15 hours per week?
Answer:
Eleven students studied around 15 hours per week.
b. How many students were there in total?
Answer:
Number of students =4+5+11+9+5+1+0+1=36
c. Suppose that the four students represented by the histogram bar centered at 5 had all studied exactly 5 hours, the five students represented by the next histogram bar had all studied exactly 10 hours, and so on.
If you were to add up the study times for all of the students, what result would you get?
Answer:
(4∙5)+(5∙10)+(11∙15)+(9∙20)+(5∙25)+(1∙30)+(0∙35)+(1∙40)=610
d. What is the mean study time for these students?
Answer:
Mean=\(\frac{610}{36}\)=16.94
e. What would you consider to be a typical deviation from the mean for this data set?
Answer:
Answers will vary. A correct answer would be something between 4 and 10 hours. (The mean absolute deviation from the mean for the original data set was 5.2, and the standard deviation was 7.1.)
Eureka Math Algebra 1 Module 2 Lesson 4 Exit Ticket Answer Key
Five people were asked approximately how many hours of TV they watched per week. Their responses were as follows.
![]()
Question 1.
Find the mean number of hours of TV watched for these five people.
Answer:
Mean=\(\frac{6+4+6+7+8}{5}\)=6.2
Question 2.
Find the deviations from the mean for these five data values.
Answer:
The deviations from the mean are -0.2, -2.2, -0.2, 0.8, and 1.8.
Question 3.
Write a new set of five values that has roughly the same mean as the data set above but that has, generally speaking, greater deviations from the mean.
Answer:
There are many correct answers to this question. Check that students’ answers contain five numbers, that the mean is around 6.2, and that the spread of the numbers is obviously greater than that of the original set of five values. Here is one example: 0, 0, 0, 15, 16.