Engage NY Eureka Math Algebra 1 Module 2 Lesson 2 Answer Key
Eureka Math Algebra 1 Module 2 Lesson 2 Exploratory Challenge Answer Key
Exploratory Challenge/Exercises 1–9
Consider the following three sets of data.
Data Set 1: Pet owners
Students from River City High School were randomly selected and asked, “How many pets do you currently own?” The results are recorded below.

→ Can we assume that all students interpret the question “How many pets do you currently own?” in the same way?
Data Set 2: Length of the east hallway at River City High School
Twenty students were selected to measure the length of the east hallway. Two marks were made on the hallway’s floor: one at the front of the hallway and one at the end of the hallway. Each student was given a meter stick and asked to use the meter stick to determine the length between the marks to the nearest tenth of a meter. The results are recorded below.

→ Why would the same hallway have different reported measures of length?
→ What measures of the length of the hallway do you think are the most accurate from the data set?
Data Set 3: Age of cars
Twenty-five car owners were asked the age of their cars in years. The results are recorded below.

→ What number would you use to describe the typical age of cars in years by the car owners in this group?
Students now work through Exercises 1–9 of their lesson. Students determine for each distribution if the mean and the median are different or similar and how those characteristics relate to the distribution. Students relate their answers in the context of the data set.
Several of the questions within the exercises can be posed verbally as part of a discussion with students. Other questions may require written responses. Review the questions, and decide what format is best for your students.
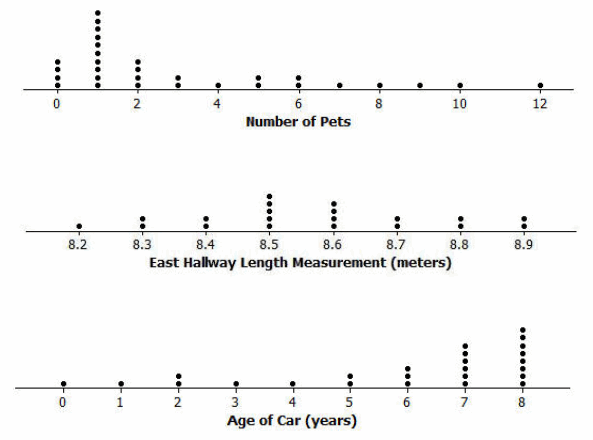
Exercise 1.
Make a dot plot of each of the data sets. Use the following scales.
Answer:
Exercise 2.
Calculate the mean number of pets owned by the thirty students from River City High School. Calculate the median number of pets owned by the thirty students.
Answer:
The mean number of pets owned is 3.2.
The median number of pets owned is 2.
Exercise 3.
What do you think is a typical number of pets for students from River City High School? Explain how you made your estimate.
Answer:
The median is a better description of a typical value. The median is less than the mean because more of the data are located on the left side of the scale. The value of the mean is “pulled up” by the larger values in the data set.
Exercise 4.
Why do you think that different students got different results when they measured the same distance of the east hallway?
Answer:
Measurement errors occurred as a result of the placement of the meter stick at the starting point, the alignment of the meter stick after each length was made, and the different interpretation made by the person making the measurement.
Exercise 5.
What is the mean length of the east hallway data set? What is the median length?
Answer:
The mean length is approximately 8.57 meters.
The median length is approximately 8.55 meters.
They are approximately the same.
Exercise 6.
A construction company will be installing a handrail along a wall from the beginning point to the ending point of the east hallway. The company asks you how long the handrail should be. What would you tell the company? Explain your answer.
Answer:
It should be approximately 8.6 meters. Since the distribution is nearly symmetric, the mean should be used as a measure of center.
Exercise 7.
Describe the distribution of the age of cars.
Answer:
The distribution is not symmetric. It is skewed to the left. Most of the data are on the right-hand side with a long tail to the left.
Exercise 8.
What is the mean age of the twenty-five cars? What is the median age? Why are the mean and the median different?
Answer:
The mean age is approximately 5.84 years old, and the median age is 7 years old. They are different. The mean is smaller because of the small values in the tail of the data distribution.
Exercise 9.
What number would you use as an estimate of the typical age of a car for the twenty-five car owners? Explain your answer.
Answer:
The median is a better description of a typical age because the distribution is skewed.
Eureka Math Algebra 1 Module 2 Lesson 2 Problem Set Answer Key
Consider the following scenario. The company that created a popular video game “Leaders” plans to release a significant upgrade of the game. Users earn or lose points for making decisions as the leader of an imaginary country. In most cases, repeated playing of the game improves a user’s ability to make decisions. The company will launch an online advertising campaign, but at the moment, they are not sure how to focus the advertising. Your goal is to help the company decide how the advertising campaign should be focused. Five videos have been proposed for the following target audiences:
Video 1: Target females with beginning level scores
Video 2: Target males with advanced level scores
Video 3: Target all users with middle range level scores
Video 4: Target males with beginning level scores
Video 5: Target females with advanced level scores
Question 1.
Why might the company be interested in developing different videos based on user score?
Answer:
Answers may vary.
Question 2.
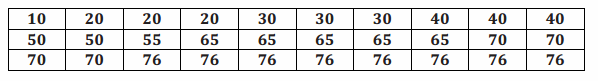
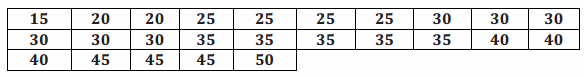
Thirty female users and twenty-five male users were selected at random from a database of people who play the game regularly. Each of them agreed to be part of a research study and report their scores. A leadership score is based on a player’s answers to leadership questions. A score of 1 to 40 is considered a beginning level leadership score, a score of 41 to 60 is considered a middle level leadership score, and a score of greater than 60 is considered an advanced level leadership score.
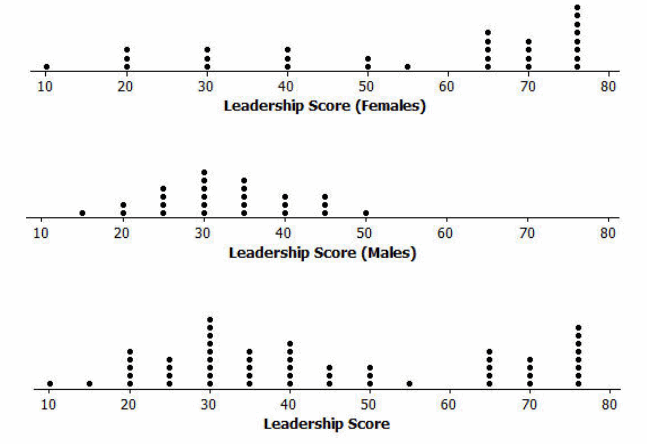
Use the following data to make a dot plot of the female scores, a dot plot of the male scores, and a dot plot of the scores for the combined group of males and females.
Female scores:
Male scores:
Answer:
Question 3.
What do you think is a typical score for a female user? What do you think is a typical score for a male user? Explain how you determined these typical scores.
Answer:
The mean score for the female users is approximately 54.9, and the median score is 65. The median is a better description of a typical score for females. Students may note that the mean score describes a female user at the middle level of leadership, and the median score describes a female user at the advanced level. The median is a better description of a typical score for females.
The mean score for the male users is approximately 32.6, and the median score is 30. This has an approximate symmetrical distribution, and this is why the mean and the median are nearly equal. The mean is a good description of a typical score for males. Students may further indicate that this describes males at the beginning level of this game.
Question 4.
Why is it more difficult to report a typical score for the overall group that includes both the males and females?
Answer:
The overall distribution is difficult to summarize in terms of shape. It obviously combines the symmetrical shape from the male users and the skewed shape from the female users. The mean score of all users is approximately 44.8. The median score is 40. The mean and the median are not the same, but the values are relatively close. The mean is often interpreted as a balance point for this type of distribution. This interpretation of a mean is developed in the next lesson; however, it is also discussed in the Grade 6 standards and could be introduced again with this Problem Set.
Question 5.
Production costs will only allow for two video advertisements to be developed. Which two videos would you recommend for development? Explain your recommendations.
Answer:
In recommending which videos to produce based on the dot plots and measure of center, students will generally select Video 4 (males with beginning level scores) and Video 5 (females with advanced level scores).
Eureka Math Algebra 1 Module 2 Lesson 2 Exit Ticket Answer Key
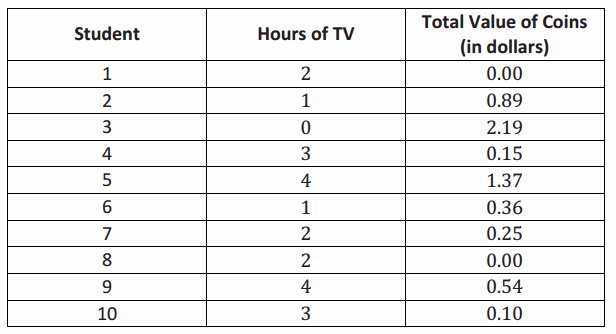
Each person in a random sample of ten ninth graders was asked two questions:
→ How many hours did you spend watching TV last night?
→ What is the total value of the coins you have with you today?
Here are the data for these ten students:
Question 1.
Construct a dot plot of the data on Hours of TV. Would you describe this data distribution as approximately symmetric or as skewed?
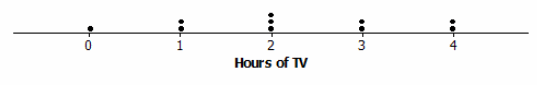
Answer:
This distribution is approximately symmetric.
Question 2.
If you wanted to describe a typical number of hours of TV watched for these ten students, would you use the mean or the median? Calculate the value of the measure you selected.
Answer:
Because the distribution is approximately symmetric, I would use the mean. The value of the mean is \(\frac{22}{10}\) or
2.2 hours.
Question 3.
Here is a dot plot of the data on Total Value of Coins.
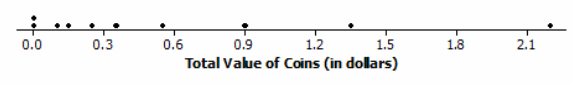
Calculate the values of the mean and the median for this data set.
Answer:
Mean =\(\frac{5.85}{10}\)=0.585, or about 59 cents. Arranging the data in order from smallest to largest, you get
![]()
The median is the average of the two middle numbers, \(\frac{0.25+0.36}{2}\)=0.305, or about 31 cents.
Question 4.
Why are the values of the mean and the median that you calculated in Problem 3 so different? Which of the mean and the median would you use to describe a typical value of coins for these ten students?
Answer:
The values of the mean and median are different because the data distribution is skewed, and the mean is pulled up by the large values in the data set. Because the data distribution is skewed, the median would be a better choice for describing a typical value.