Engage NY Eureka Math Algebra 1 Module 2 Lesson 13 Answer Key
Eureka Math Algebra 1 Module 2 Lesson 13 Example Answer Key
Example 1.
Modeling Relationships
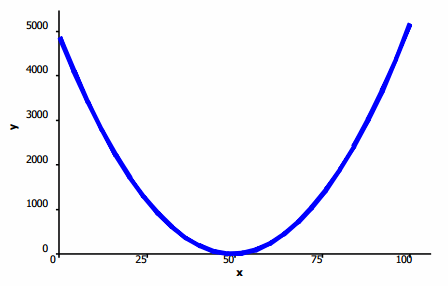
Sometimes the pattern in a scatter plot looks like the graph of a quadratic function (with the points falling roughly in the shape of a U that opens up or down), as in the graph below.
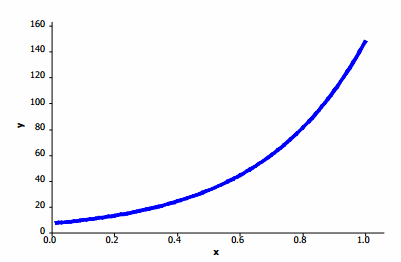
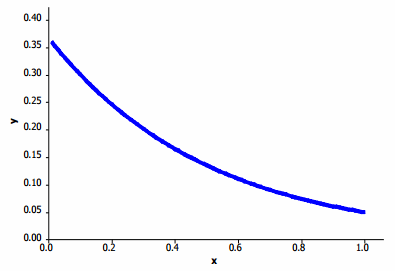
In other situations, the pattern in the scatter plot might look like the graphs of exponential functions that either are upward sloping (Graph 1) or downward sloping (Graph 2).
Graph 1: Exponential—upward sloping
Graph 2: Exponential—downward sloping
Example 2.
A Quadratic Model
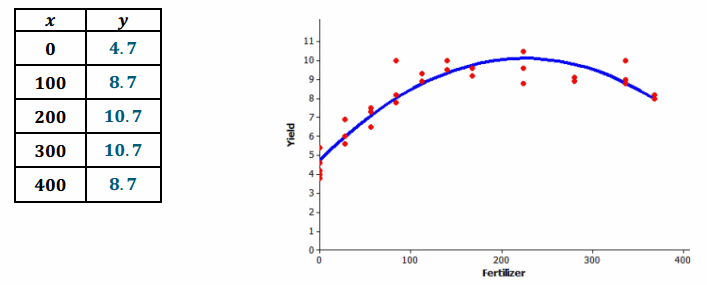
Farmers sometimes use fertilizers to increase crop yield but often wonder just how much fertilizer they should use. The data shown in the scatter plot below are from a study of the effect of fertilizer on the yield of corn.
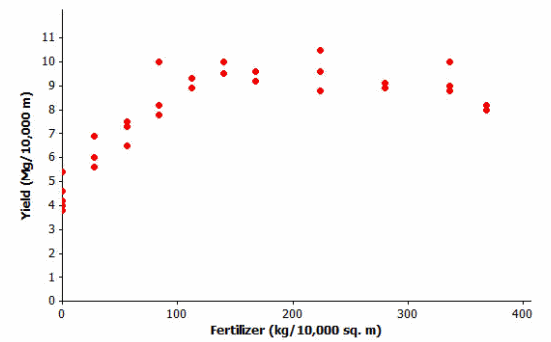
Data Source: M.E. Cerrato and A.M. Blackmer, “Comparison of Models for Describing Corn Yield Response to Nitrogen Fertilizer” Agronomy Journal, 82 (1990): 138.
Example 3.
An Exponential Model
How do you tell how old a lobster is? This question is important to biologists and to those who regulate lobster trapping. To answer this question, researchers recorded data on the shell length of 27 lobsters that were raised in a laboratory and whose ages were known.
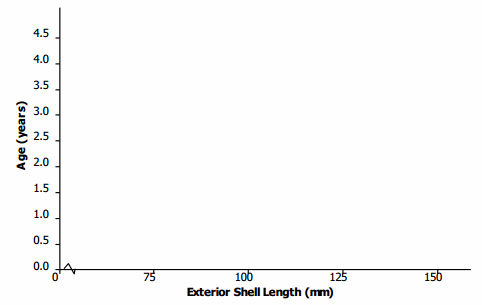
Data Source: Kerry E. Maxwell, Thomas R. Matthews, Matt R.J. Sheehy, Rodney D. Bertelsen, and Charles D. Derby, “Neurolipofuscin is a Measure of Age in Panulirus argus, the Caribbean Spiny Lobster, in Florida” Biological Bulletin, 213 (2007): 55.
Eureka Math Algebra 1 Module 2 Lesson 13 Exercise Answer Key
Exercises 1–6
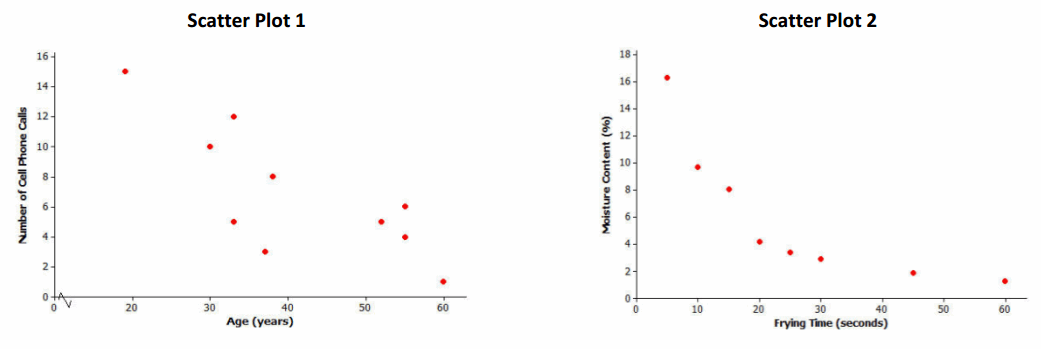
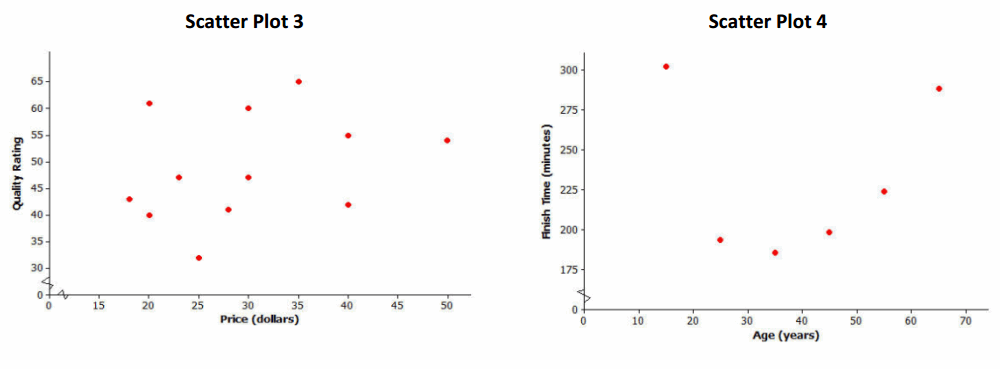
Consider again the five scatter plots discussed in the previous lesson.
Exercise 1.
Which of the five scatter plots from Lesson 12 shows a pattern that could be reasonably described by a quadratic curve?
Answer:
Scatter Plot 4. Discuss with students how the pattern in the scatter plot fits the quadratic curve.
Exercise 2.
Which of the five scatter plots shows a pattern that could be reasonably described by an exponential curve?
Answer:
Scatter Plot 2. Discuss with students how the pattern of the data points fits the exponential curve.
Discuss how predictions can be found using a model. Ask students:
→ How can a graph be used to make a prediction?
→ Estimate the value from the line or curve.
→ How can a model be used to make a prediction?
→ A value can be substituted for a variable in the model to solve for the other variable.
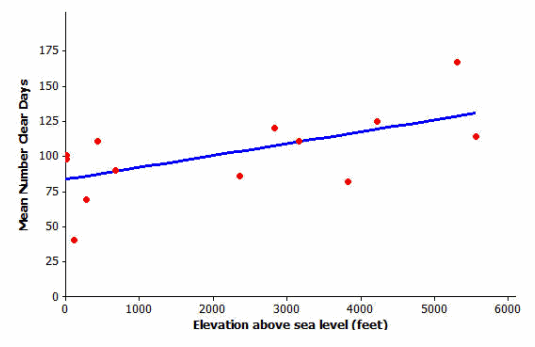
Let’s revisit the data on elevation (in feet above sea level) and mean number of clear days per year. The scatter plot of this data is shown below. The plot also shows a straight line that can be used to model the relationship between elevation and mean number of clear days. (In Grade 8, you informally fit a straight line to model the relationship between two variables. The next lesson shows a more formal way to fit a straight line.) The equation of this line is y=83.6+0.008x.
Exercise 3.
Assuming that the 14 cities used in this scatter plot are representative of cities across the United States, should you see more clear days per year in Los Angeles, which is near sea level, or in Denver, which is known as the mile-high city? Justify your choice with a line showing the relationship between elevation and mean number of clear days.
Answer:
Denver, since the number of clear days increases as elevation increases.
Provide the data set from the previous lesson. Using the data, students can see which city is plotted on the graph.
From the graph and data set, Los Angeles had about 84 clear days; Denver had about 125 clear days.
From the linear model, Los Angeles (x=0) had 83.6 clear days, and Denver (x=5,280) had 125.84 clear days.
Exercise 4.
One of the cities in the data set was Albany, New York, which has an elevation of 275 ft. If you did not know the mean number of clear days for Albany, what would you predict this number to be based on the line that describes the relationship between elevation and mean number of clear days?
Answer:
Let x=275 and substitute the value into the model. The predicted number of clear days is 85.8 days or about
86 days.
Exercise 5.
Another city in the data set was Albuquerque, New Mexico. Albuquerque has an elevation of 5,311 ft. If you did not know the mean number of clear days for Albuquerque, what would you predict this number to be based on the line that describes the relationship between elevation and mean number of clear days?
Answer:
Let x=5,311 and substitute the value into the model. The predicted number of clear days is 126.088 or about 126 days.
Exercise 6.
Was the prediction of the mean number of clear days based on the line closer to the actual value for Albany with
69 clear days or for Albuquerque with 167 clear days? How could you tell this from looking at the scatter plot with the line shown above?
Answer:
The prediction (86 clear days) was closer for Albany, which had 69 actual clear days. The distance from the predicted point on the line to the point representing Albany showed a smaller distance than the point corresponding to Albuquerque.
Exercises 7–9
Exercise 7.
The researchers who conducted this study decided to use a quadratic curve to describe the relationship between yield and amount of fertilizer. Explain why they made this choice.
Answer:
In the beginning, as the amount of fertilizer (x) increases, so does the yield (y). But then around 250 kg, the yield begins to decrease as the amount of fertilizer increases.
Exercise 8.
The model that the researchers used to describe the relationship was y=4.7+0.05x-0.0001x2, where x represents the amount of fertilizer (kg per 10,000 sq.m) and y represents corn yield (Mg per 10,000 sq.m).
Use this quadratic model to complete the following table. Then sketch the graph of this quadratic equation on the scatter plot.
Answer:
Encourage students to also use a graphing calculator or statistical software to construct the table and the curve. Students can also construct the curve by plotting the points in the table.
Exercise 9.
Based on this quadratic model, how much fertilizer per 10,000 sq.m would you recommend that a farmer use on his cornfields in order to maximize crop yield? Justify your choice.
Answer:
About 225−250″ ” kg per 10,000 sq.m
Exercises 10–13
Exercise 10.
The researchers who conducted this study decided to use an exponential curve to describe the relationship between age and exterior shell length. Explain why they made this choice.
Answer:
As the length of the exterior shell increases, the age of the lobster tends to increase. The change in age is greater as the shell length increases, suggesting the exponential model.
Exercise 11.
The model that the researchers used to describe the relationship is y=10^(-0.403 + 0.0063x), where x represents the exterior shell length (mm), and y represents the age of the lobster (in years). The exponential curve is shown on the scatter plot below. Does this model provide a good description of the relationship between age and exterior shell length? Explain why or why not.
Answer:
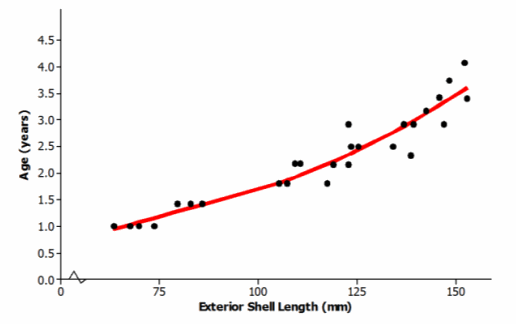
The model does a good job of describing the relationship; the data points lie reasonably close to the model.
Exercise 12.
Based on this exponential model, what age is a lobster with an exterior shell length of 100 mm?
Answer:
From the graph: About 1.75 years old
From the model: y=10-0.403 + 0.0063x
Therefore, y=10-0.403 + 0.0063(100), or approximately 1.69 years old.
Exercise 13.
Suppose that trapping regulations require that any lobster with an exterior shell length less than 75 mm or more than 150 mm must be released. Based on the exponential model, what are the ages of lobsters with exterior shell lengths less than 75 mm? What are the ages of lobsters with exterior shell lengths greater than 150 mm? Explain how you arrived at your answer.
Answer:
Lobsters less than 75 mm would be about 1 year or less in age. Lobsters that are more than 150 mm would be approximately 3.5 years or older.
Students can use the model or estimate from the graph. Share with students that not only are lobsters released if they are too small (or young) but also if they are too large.
Eureka Math Algebra 1 Module 2 Lesson 13 Problem Set Answer Key
Biologists conducted a study of the nesting behavior of a type of bird called a flycatcher. They examined a large number of nests and recorded the latitude for the location of the nest and the number of chicks in the nest.
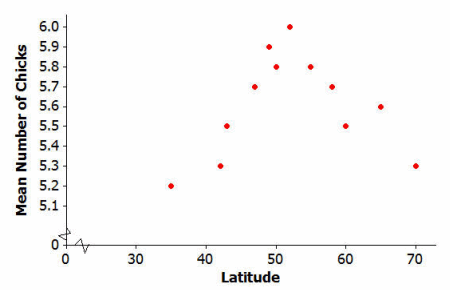
Data Source: Juan José Sanz, “Geographic variation in breeding parameters of the pied flycatcher Ficedula hypoleuca” Ibis, 139 (1997): 107.
Question 1.
What type of model (linear, quadratic, or exponential) would best describe the relationship between latitude and mean number of chicks?
Answer:
The relationship between latitude in degrees and mean number of chicks is best described by a quadratic model.
Question 2.
One model that could be used to describe the relationship between mean number of chicks and latitude is
y=0.175+0.21x-0.002x2, where x represents the latitude of the location of the nest and y represents the number of chicks in the nest. Use the quadratic model to complete the following table. Then sketch a graph of the quadratic curve on the scatter plot at the beginning of the Problem Set.
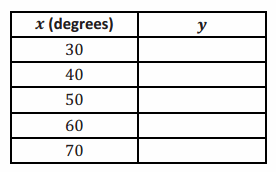
Answer:
Question 3.
Based on this quadratic model, what is the best latitude for hatching the most flycatcher chicks? Justify your choice.
Answer:
The best latitude is the highest point, which is 55 degrees latitude.
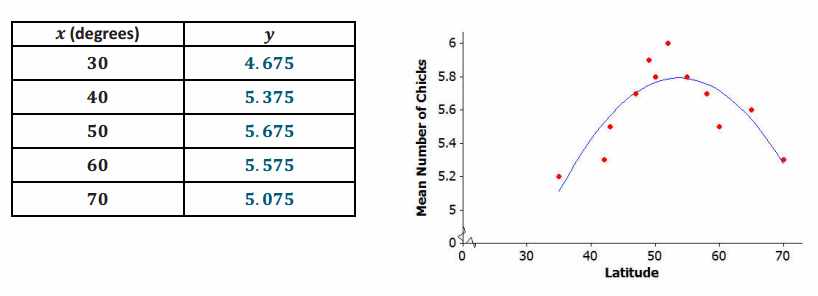
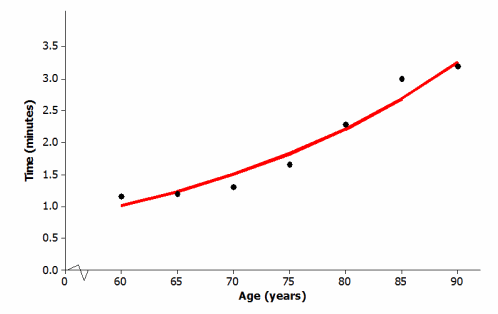
Suppose that social scientists conducted a study of senior citizens to see how the time (in minutes) required to solve a word puzzle changes with age. The scatter plot below displays data from this study.
Let x equal the age of the citizen and y equal the time (in minutes) required to solve a word puzzle for the seven study participants.
Question 4.
What type of model (linear, quadratic, or exponential) would you use to describe the relationship between age and time required to complete the word puzzle?
Answer:
Exponential
Question 5.
One model that could describe the relationship between age and time to complete the word puzzle is
y=10-1.01 + 0.017x. This exponential curve is shown on the scatter plot below. Does this model do a good job of describing the relationship between age and time to complete the word puzzle? Explain why or why not.
Answer:
Evaluation is subjective; the data points are close to the model; therefore, it does a good job of describing the relationship between age and time to complete the word puzzle.
Question 6.
Based on this exponential model, what time would you predict for a person who is 78 years old?
Answer:
Based on the graph, an estimate of about 2 min”.” would be reasonable. Using the model equation, y=10-1.01 + 0.017(78), or approximately 2 min.
Eureka Math Algebra 1 Module 2 Lesson 13 Exit Ticket Answer Key
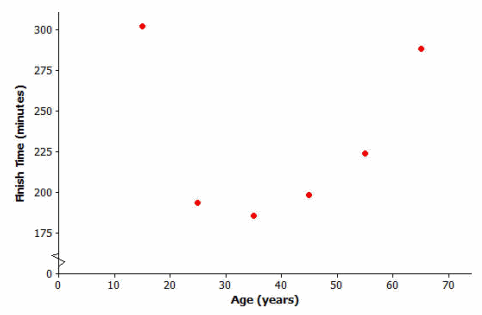
Question 1.
Here is the scatter plot of age (in years) and finish time (in minutes) of the NY City Marathon that you first saw in an example. What type of model (linear, quadratic, or exponential) would best describe the relationship between age and finish time? Explain your reasoning.
Answer:
The relationship between age and finish time is best described by a quadratic model. As age increases, finish times decrease until they reach a minimum value and then begin to increase.
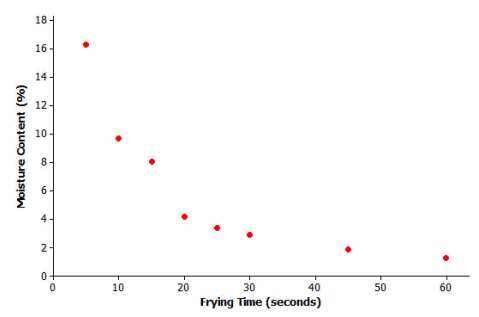
Question 2.
Here is the scatter plot of frying time (in seconds) and moisture content (as a percentage) you first saw in Lesson 12. What type of model (linear, quadratic, or exponential) would best describe the relationship between frying time and moisture content? Explain your reasoning.
Answer:
The relationship between frying time and moisture content is exponential. As the frying time increases, the moisture content decreases. The amount of decrease is slowing as the frying time increases; therefore, it is an exponential decrease.