Engage NY Eureka Math Algebra 1 Module 2 Lesson 14 Answer Key
Eureka Math Algebra 1 Module 2 Lesson 14 Example Answer Key
Example 1.
Using a Line to Describe a Relationship
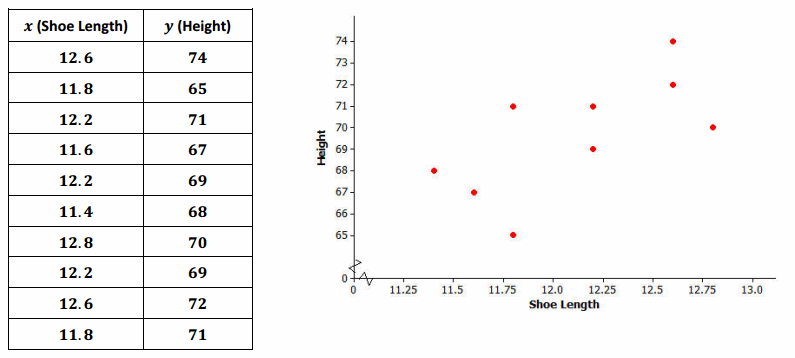
Kendra likes to watch crime scene investigation shows on television. She watched a show where investigators used a shoe print to help identify a suspect in a case. She questioned how possible it is to predict someone’s height from his shoe print.
To investigate, she collected data on shoe length (in inches) and height (in inches) from 10 adult men. Her data appear in the table and scatter plot below.
Example 2.
Using Models to Make Predictions
When two variables x and y are linearly related, you can use a line to describe their relationship. You can also use the equation of the line to predict the value of the y-variable based on the value of the x-variable.
For example, the line y=25.3+3.66x might be used to describe the relationship between shoe length and height, where x represents shoe length and y represents height. To predict the height of a man with a shoe length of 12 in., you would substitute 12 for x in the equation of the line and then calculate the value of y.
y=25.3+3.66x=25.3+3.66(12)=69.22
You would predict a height of 69.22 in. for a man with a shoe length of 12 in.
Remind students that a model (equation) can be used to describe the relationship between variables.
→ Explain that the model can be used to make predictions by substituting a value for one variable to solve for the other.
→ Discuss how to use the model given in the student lesson to predict a man’s height using a shoe length of 12 in.
Example 3.
Residuals
One way to think about how useful a line is for describing a relationship between two variables is to use the line to predict the y-values for the points in the scatter plot. These predicted values could then be compared to the actual
y-values.
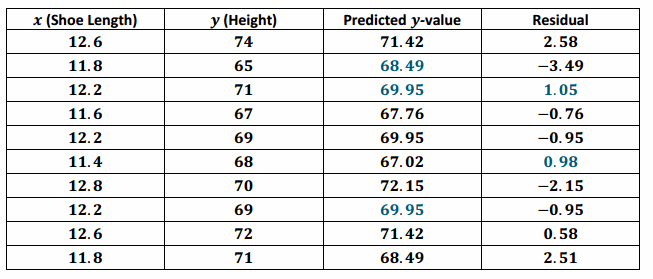
For example, the first data point in the table represents a man with a shoe length of 12.6 in. and height of 74 in. If you use the line y=25.3+3.66x to predict this man’s height, you would get:
y=25.3+3.66x
=25.3+3.66(12.6)
=71.42
His predicted height is 71.42 in. Because his actual height was 74 in., you can calculate the prediction error by subtracting the predicted value from the actual value. This prediction error is called a residual. For the first data point, the residual is calculated as follows:
Residual=actual y-value – predicted y-value
=74-71.42
=2.58
Eureka Math Algebra 1 Module 2 Lesson 14 Exercise Answer Key
Exercises 1–2
Exercise 1.
Is there a relationship between shoe length and height?
Answer:
Yes, it looks like there is a relationship between shoe length and height.
Exercise 2.
How would you describe the relationship? Do the men with longer shoe lengths tend be taller?
Answer:
As shoe length increases, height tends to increase. Men with longer shoe lengths tend to be taller.
Exercises 3–7
Exercise 3.
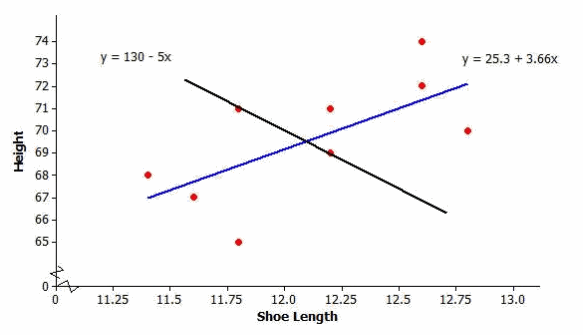
Below is a scatter plot of the data with two linear models, y=130-5x and y=25.3+3.66x. Which of these two models does a better job of describing how shoe length (x) and height (y) are related? Explain your choice.
Answer:
The line of y=25.3+3.66x is a better choice because as shoe length increases, height tends to increase.
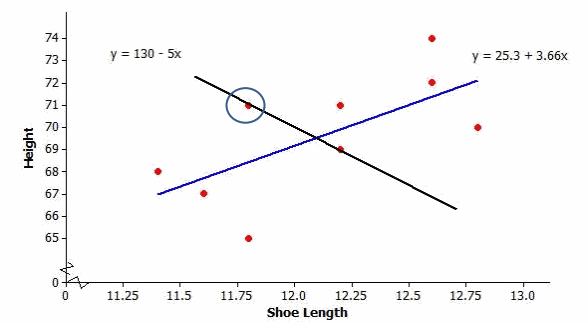
Exercise 4.
One of the men in the sample has a shoe length of 11.8 in. and a height of 71 in. Circle the point in the scatter plot in Exercise 3 that represents this man.
Answer:
The point (11.8,71) should be circled on the scatter plot.
Exercise 5.
Suppose that you do not know this man’s height but do know that his shoe length is 11.8 in. If you use the model y=25.3+3.66x, what would you predict his height to be? If you use the model y=130-5x, what would you predict his height to be?
Answer:
For the first model: y=25.3+3.66(11.8)=68.488
For the second model: y=130-5(11.8)=71
Using the first model, the man’s predicted height is 68.488 in. Using the second model, his predicted height is 71 in.
Exercise 6.
Which model was closer to the actual height of 71 in.? Is that model a better fit to the data? Explain your answer.
Answer:
The model y=130-5x was closer to the actual value, but that is not the better model because y=25.3+3.66x is closer to more points.
Exercise 7.
Is there a better way to decide which of two lines provides a better description of a relationship (rather than just comparing the predicted value to the actual value for one data point in the sample)?
Answer:
The better line (or the line with the best fit) is the one in which the distances from the points to the line are as short as possible. Highlight a few of the points and the distances from the points to the line. Highlight the vertical distances from various points to the line to show students how the values of residuals help us evaluate a line’s fit.
Exercises 8–10
Exercise 8.
For the line y=25.3+3.66x, calculate the missing values, and add them to complete the table.
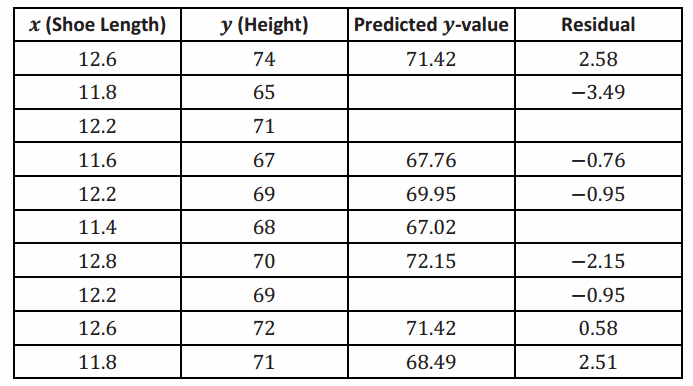
Answer:
Exercise 9.
Why is the residual in the table’s first row positive and the residual in the second row negative?
Answer:
The actual value is larger than the predicted value in the first row, so the difference is positive. In the second row, the actual value is less than the predicted value, so the difference is negative.
Exercise 10.
What is the sum of the residuals? Why did you get a number close to zero for this sum? Does this mean that all of the residuals were close to 0?
Answer:
The sum of the residuals is -0.6. This number is close to 0 because the positive and negative values of the residuals balance each other out. Not all residuals are close to zero. (Refer to the table.)
Exercises 11–13
When you use a line to describe the relationship between two numerical variables, the best line is the line that makes the residuals as small as possible overall.
Exercise 11.
If the residuals tend to be small, what does that say about the fit of the line to the data?
Answer:
If the residuals are small, the points tend to be close to the line.
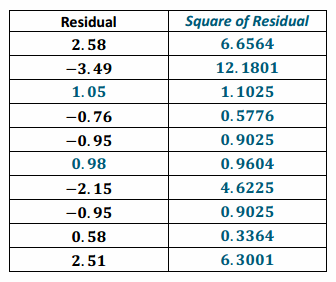
Explain that it is the sum of the squared residuals that leads to choosing the line of best fit. Tell students to square the residuals in the table (Exercise 8) and place their answers in a column they construct to the right of the table. Pose the following questions one at time to the class.
The most common choice for the best line is the line that makes the sum of the squared residuals as small as possible. Add a column on the right of the table in Exercise 8. Calculate the square of each residual and place the answer in the column.
Exercise 12.
Why do we use the sum of the squared residuals instead of just the sum of the residuals (without squaring)?
Hint: Think about whether the sum of the residuals for a line can be small even if the prediction errors are large. Can this happen for squared residuals?
Answer:
If you just add all of the residuals, positive and negative residuals can offset one another, and you can get a small sum even if some of the residuals are big. Squaring the residuals gives positive values that still reflect how far the data points are from the line.
Exercise 13.
What is the sum of the squared residuals for the line y=25.3+3.66x and the data of Exercise 11?
Answer:
The sum of the squared residuals (rounded to the nearest hundredth) is 34.54.
Exercise 14.
Enter the shoe-length and height data, and then use your calculator to find the equation of the least squares line. Did you get y=25.3+3.66x? (The slope and y-intercept here have been rounded to the nearest hundredth.)
Answer;
The exact equation of the least squares line is Y1=25.276 859 504 133+3.657 024 793 388 4x. When rounded to the nearest tenth for the y-intercept and hundredth for the slope, the equation is y=25.3+3.66x.
Exercise 15.
Assuming that the 10 men in the sample are representative of adult men in general, what height would you predict for a man whose shoe length is 12.5 in.? What height would you predict for a man whose shoe length is 11.9 in.?
Answer:
The predicted height of a man whose shoe length is 12.5 in. is 71.05 in. The predicted height of a man whose shoe length is 11.9 in. is 68.86 in.
Once you have found the equation of the least squares line, the values of the slope and y-intercept of the line often reveal something interesting about the relationship you are modeling.
The slope of the least squares line is the change in the predicted value of the y-variable associated with an increase of one in the value of the x-variable.
Exercise 16.
Give an interpretation of the slope of the least squares line y=25.3+3.66x for predicting height from shoe size for adult men.
Answer:
The slope is 3.66; for every 1 in. increase in a man’s shoe length, you would estimate an increase of 3.66 in. in height.
The y-intercept of a line is the predicted value of y when x equals zero. When using a line as a model for the relationship between two numerical variables, it often does not make sense to interpret the y-intercept because a x-value of zero may not make any sense.
Exercise 17.
Explain why it does not make sense to interpret the y-intercept of 25.3 as the predicted height for an adult male whose shoe length is zero.
Answer:
The y-intercept is (0,25.3). Since x represents shoe length, it is impossible for the shoe length to be 0 in. when a man is 25.3 in. tall.
Eureka Math Algebra 1 Module 2 Lesson 14 Problem Set Answer Key
If time permits, the following data set and questions provide an opportunity to give hands-on examples. Consider providing actual shoe prints from students or individuals (children and adults). Create a scenario in which the shoe print is evidence, and have the class figure out who done it?
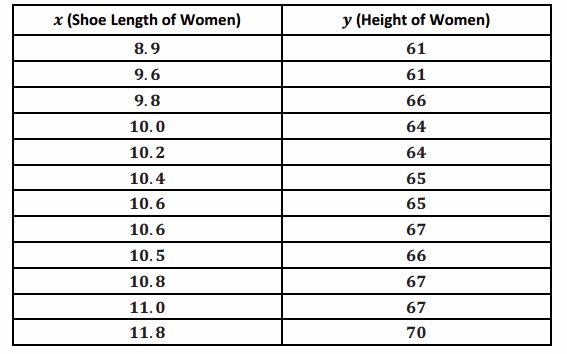
Kendra wondered if the relationship between shoe length and height might be different for men and women.
To investigate, she also collected data on shoe length (in inches) and height (in inches) for 12 women.
Question 1.
Construct a scatter plot of these data.
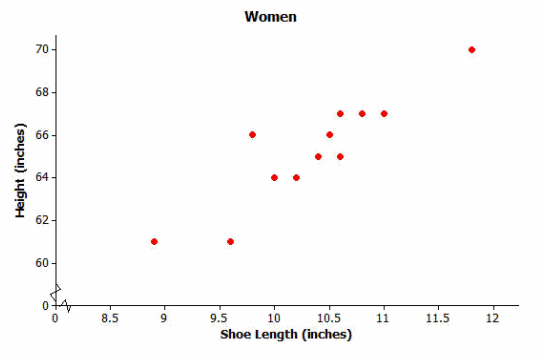
Question 2.
Is there a relationship between shoe length and height for these 12 women?
Answer:
Yes, as shoe length increases, height also tends to increase.
Question 3.
Find the equation of the least squares line. (Round values to the nearest hundredth.)
Answer:
The least squares line is y=32.68+3.15x.
Question 4.
Suppose that these 12 women are representative of adult women in general. Based on the least squares line, what would you predict for the height of a woman whose shoe length is 10.5 in.? What would you predict for the height of a woman whose shoe length is 11.5 in.?
Answer:
The predicted height for a woman whose shoe length is 10.5″ ” in. would be 65.76 in., or 66 in. to the nearest inch. The predicted height for a woman whose shoe length is 11.5 in. would be 68.91 in., or 69 in. to the nearest inch.
Question 5.
One of the women in the sample had a shoe length of 9.8 in. Based on the regression line, what would you predict for her height?
Answer:
y=32.68+3.15(9.8)=63.55
Her predicted height is 63.55 in.
Question 6.
What is the value of the residual associated with the observation for the woman with the shoe length of 9.8 in.?
Answer:
The residual would be the actual value minus the predicted value, or 66″ ” in.- 63.55 in.=2.45″ ” in.
Question 7.
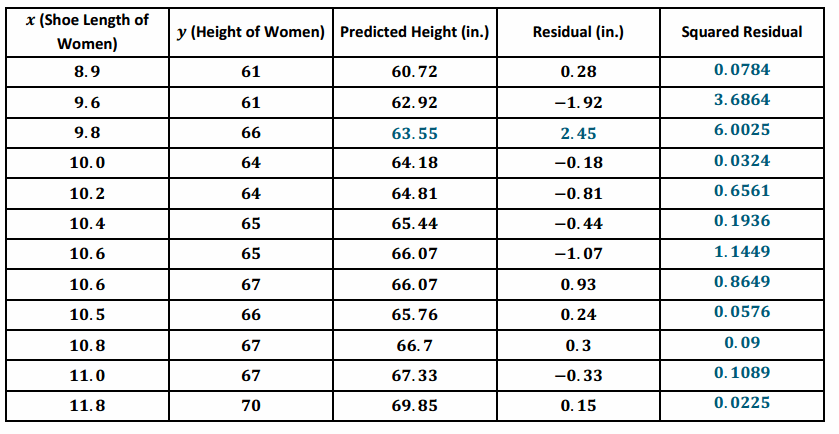
Add the predicted value and the residual you just calculated to the table below. Then, calculate the sum of the squared residuals.
Answer:
The sum of the squared residuals is 12.94. (Note: The predicted heights and residuals come from the rounded values in the model not the exact values generated from the regression line using the calculator.)
Question 8.
Provide an interpretation of the slope of the least squares line.
Answer:
We would predict an increase of 3.15 in. in height for an increase of 1 in. in shoe length.
Question 9.
Does it make sense to interpret the y-intercept of the least squares line in this context? Explain why or why not.
Answer:
The intercept would be based on a shoe length of zero inches. This would not make sense.
Question 10.
Would the sum of the squared residuals for the line y=25+2.8x be greater than, about the same as, or less than the sum you computed in Problem 7? Explain how you know this. You should be able to answer this question without calculating the sum of squared residuals for this new line.
Answer:
The sum of squared residuals will be greater for the line y=25+2.8x. The equation y=32.68+3.15x is the approximate equation of the least squares line, so it has a smaller sum of squared residuals than any other line.
Question 11.
For the men, the least squares line that describes the relationship between x, which represents shoe length (in inches), and y, which represents height (in inches), was y=25.3+3.66x. How does this compare to the equation of the least squares line for women? Would you use y=25.3+3.66x to predict the height of a woman based on her shoe length? Explain why or why not.
Answer:
The slope is greater for men; a one-inch increase in shoe length translates to a greater increase in height for men compared to women. The y-intercept is greater for women. To predict the height of a woman, the least squares line for women must be used because it is the best fit.
Question 12.
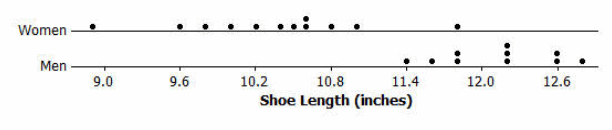
Below are dot plots of the shoe lengths for women and the shoe lengths for men. Suppose that you found a shoe print and that when you measured the shoe length, you got 10.8 in. Do you think that a man or a woman left this shoe print? Explain your choice.
Answer:
It is more likely that a woman left the shoe print with length 10.8 in. based on the clustering around the value.
Question 13.
Suppose that you find a shoe print and the shoe length for this print is 12 in. What would you predict for the height of the person who left this print? Explain how you arrived at this answer.
Answer:
The print most likely belongs to a man. Use the least squares line for men to predict a height, or y=25.3+3.66(12), which is 69.22 in., to the nearest hundredth of an inch.
Eureka Math Algebra 1 Module 2 Lesson 14 Exit Ticket Answer Key
Question 1.
The scatter plot below displays the elevation and mean number of clear days per year of 14 U.S. cities. Two lines are shown on the scatter plot. Which represents the least squares line? Explain your choice.
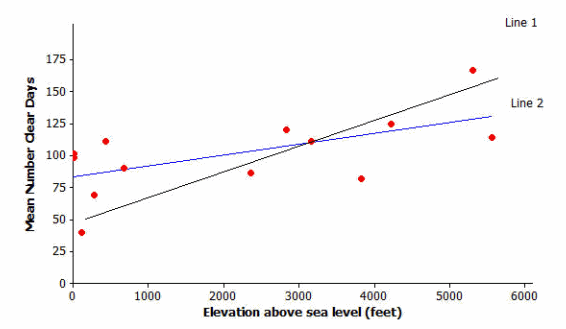
Answer:
Line 2 represents the least squares line because it appears to have smaller residuals overall.
Question 2.
Below is a scatter plot of foal birth weight and mare’s weight.
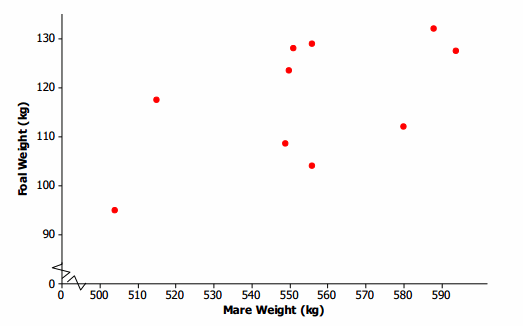
The equation of the least squares line for these data is y=-19.6+0.248x, where x represents the mare’s weight (in kg) and y represents the foal’s birth weight (in kg).
a. What foal birth weight would you predict for a mare that weighs 520 kg?
Answer:
y=-19.6+0.248(520)=109.36
For a mare that weighs 520 kg, the predicted foal birth weight would be 109.36 kg.
b. How would you interpret the value of the slope in the least squares line?
Answer:
The value of the slope is 0.248, indicating that predicted foal weight increases by 0.248 kg for each 1 kg increase in the mare’s weight.
c. Does it make sense to interpret the value of the y-intercept in this context? Explain why or why not.
Answer:
It does not make sense to interpret the value of the y-intercept because it is equivalent to predicting the foal’s weight for a mare’s weight of zero, which does not make sense.