This handy Spectrum Math Grade 7 Answer Key Chapter 6 Lesson 6.2 Drawing Inferences from Data provides detailed answers for the workbook questions
Spectrum Math Grade 7 Chapter 6 Lesson 6.2 Drawing Inferences from Data Answers Key
Data sets from random samples can be used to make inferences about the data from the population.
Billy is collecting information on how long his classmates spend studying each week. He talks to 11 different students from his class of 29 and collects the information show on the histogram below.
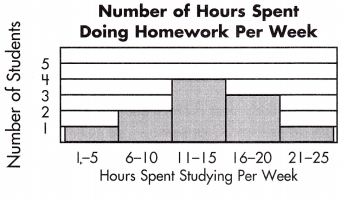
The following information can be determined using this data:
- 4 students spend 11-15 hours each week studying.
- 4 out of 11 is 36.36% of the sample.
- 36.36% of 29 is 10.54.
- This means that it is most likely that 10 or 11 students in Billy’s class spend 11-15 hours each week studying.
Use the data below to make inferences and answer the questions.
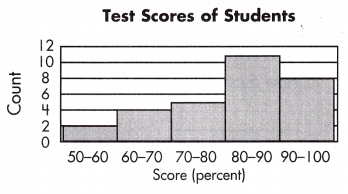
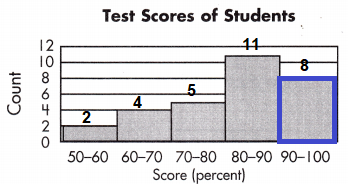
This histogram shows the test scores from a sample of 30 students. There are 125 students in the 7th grade.
Question 1.
How many students from the sample scored between 70 and 80 on the test?
Answer:
5
Explanation:
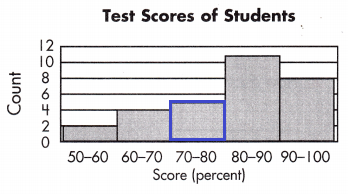
According to the information show on the histogram above,
there are 5 students scored between 70 and 80 on the test.
Question 2.
What percentage of students from the sample scored between 70 and 80 on the test?
Answer:
16.67%
Explanation:
This histogram shows the test scores from a sample of 30 students.
Total students = 2 + 4 + 5 + 11 + 8 = 30
The percentage of students from the sample scored between 70 and 80 on the test,
= \(\frac{5}{30} \) x 100
= \(\frac{500}{30} \)
= \(\frac{50}{3} \)
= 16.67%
Question 3.
Predict how many students in the 7th grade scored between 70 and 80 on the test.
Answer:
20 to 21 students.
Explanation:
This histogram shows the test scores from a sample of 30 students.
There are 125 students in the 7th grade.
= \(\frac{5}{30} \) × 125
= \(\frac{5 × 125}{30} \)
= \(\frac{125}{6} \)
= 20.83
20 to 21 students in the 7th grade scored between 70 and 80 on the test.
Question 4.
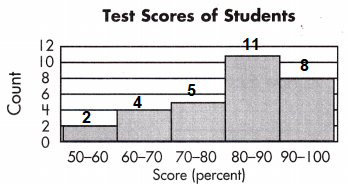
What percentage of students from the sample scored between 90 and 100 on the test?
Answer:
26.67%
Explanation:
Total students = 2 + 4 + 5 + 11 + 8 = 30
The percentage of students from the sample scored between 70 and 80 on the test,
= \(\frac{8}{30} \) × 100
= \(\frac{800}{30} \)
= \(\frac{80}{3} \)
= 26.67%
Question 5.
Based on the percentage of students from the sample who scored between 90 and 100 on the test, how many students in 7th grade scored between 90 and 100?
Answer:
33 to 34 students in the 7th grade scored between 90 and 100 on the test.
Explanation:
This histogram shows the test scores from a sample of 30 students.
There are 125 students in the 7th grade.
= \(\frac{8}{30} \) x 125
= \(\frac{8 × 125}{30} \)
= \(\frac{125}{6} \)
= 33.33 or 34
Therefore, 33 to 34 students in the 7th grade scored between 90 and 100 on the test.
Question 6.
If there were 150 students in 7th grade, how many students would have scored between 60 and 70 on the test?
Answer:
20 students in the 7th grade scored between 60 and 70 on the test.
Explanation:
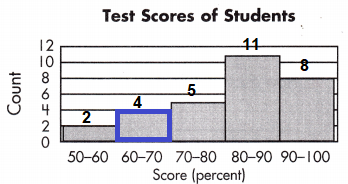
This histogram shows the test scores from a sample of 30 students.
There are 150 students in the 7th grade.
= \(\frac{4}{30} \) × 150
= \(\frac{4 × 150}{30} \)
= \(\frac{600}{30} \)
= 20
Therefore, 20 students in the 7th grade scored between 60 and 70 on the test.
The coach of the Wilson High School baseball team is collecting information about how well his pitchers are performing. He keeps data about every third game.
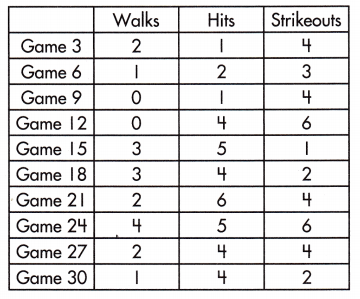
The following information can be inferred using this data:
- Pitchers struck out 4 hitters in 4 games from the sample.
- 40% of the sample games had 4 strikeouts.
- It is most likely that there were 4 strikeouts in about 12 of the 30 games.
Use the data above to answer the questions.
Question 1.
What percentage of the sample games had no walks?
Answer:
20%
Explanation:
The above given information tells about,
Baseball team is collecting information about how well his pitchers are performing.
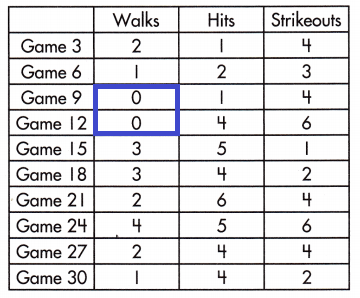
Game 9 and Game 12 had no walks
The percentage of the sample games had no walks is
= \(\frac{2}{10} \) × 100
= 20%
Question 2.
How many total hits were given up in the sample?
Answer:
36 hits.
Explanation:
The above given information tells about,
Baseball team is collecting information about how well his pitchers are performing.
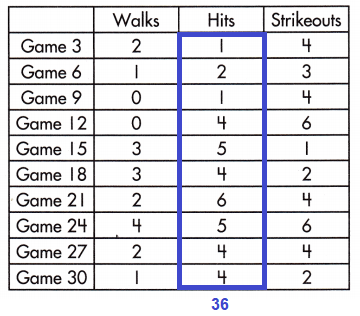
total 36 hits were given up in the sample.
Question 3.
What would be a realistic prediction about the number of total hits in 30 games?
Answer:
108 hits.
Explanation:
Total 36 hits were given up in the sample.
36 × 3 = 108
108 realistic prediction about the number of total hits in 30 games.
Question 4.
How many out of the 30 games were most likely to have had 5 or more hits?
Answer:
9 games.
Explanation:
The above given information tells about,
Baseball team is collecting information about how well his pitchers are performing.
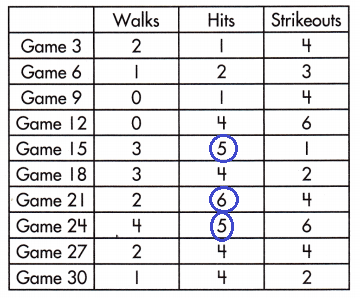
3 × 3 = 9
So, out of the 30 games were most likely to have had 5 or more hits are 9 games.
Question 5.
What percentage of the sample games had 2 walks?
Answer:
30%
Explanation:
The above given information tells about,
Baseball team is collecting information about how well his pitchers are performing.
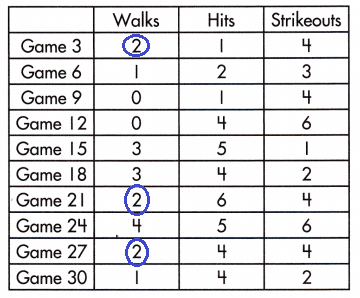
Game 3, Game 21 and Game 27 had 2 walks
The percentage of the sample games had no walks is
= \(\frac{3}{10} \) × 100
= 30%
Question 6.
What would be a realistic prediction about the number of total games that had 2 walks?
Answer:
9
Explanation:
The above given information tells about,
Baseball team is collecting information about how well his pitchers are performing.
total 3 games had 2 walks were given up in the sample.
3 × 3 = 9
So, 9 realistic prediction about the number of total walks in 30 games.
Dawn is trying to find out how many brothers and sisters, teachers in her school have. There are 54 teachers at the school, and she talks to 18 teachers. This is the data she collects: 1, 1, 1, 2, 0, 1, 2, 0, 1, 2, 4, 0, 1,2, 3, 4, 5, 9.
This is the information that can be inferred about the data Dawn collected:
- 2 out of the 18 teachers sampled have 4 siblings.
- 111% of the teachers sampled have 4 siblings.
- It is most likely that 5 or 6 teachers at the school have 4 siblings.
Use the data below to answer the questions.
Mrs. Jones is giving a science test and she is trying to make sure students are spending enough time studying for the test. She chooses 5 students from each of her four classes and asks how many hours they spent studying. She collects the following information: \(\frac{1}{2}\), 1\(\frac{1}{2}\), 3, 1, 2, 3\(\frac{1}{2}\), 1, 1\(\frac{1}{2}\), 1\(\frac{1}{2}\), 2, 3\(\frac{1}{2}\), 2, 1\(\frac{1}{2}\), 2, 2, 3\(\frac{1}{2}\), 2\(\frac{1}{2}\), 1\(\frac{1}{2}\), 3\(\frac{1}{2}\), 3.
Question 1.
How many students were included in Mrs. Jones’s sample?
Answer:
20 samples.
Explanation:
Mrs. Jones chooses 5 students from each of her 4 classes.
5 × 4 = 20 students or samples
So, the following information are about 20 samples.
\(\frac{1}{2}\), 1\(\frac{1}{2}\), 3, 1, 2, 3\(\frac{1}{2}\), 1, 1\(\frac{1}{2}\), 1\(\frac{1}{2}\), 2, 3\(\frac{1}{2}\), 2, 1\(\frac{1}{2}\), 2, 2, 3\(\frac{1}{2}\), 2\(\frac{1}{2}\), 1\(\frac{1}{2}\), 3\(\frac{1}{2}\), 3.
Question 2.
If she has 25 students in each class, how many students are in her population?
Answer:
100
Explanation:
Mrs. Jones chooses 25 students from each of her 4 classes.
25 × 4 = 100 students or population.
Question 3.
What percentage of the sample spent 2 hours studying for the test?
Answer:
25%
Explanation:
The following information are 20 samples,
the sample spent 2 hours studying for the test = 5
\(\frac{1}{2}\), 1\(\frac{1}{2}\), 3, 1, 2, 3\(\frac{1}{2}\), 1, 1\(\frac{1}{2}\), 1\(\frac{1}{2}\), 2, 3\(\frac{1}{2}\), 2, 1\(\frac{1}{2}\), 2, 2, 3\(\frac{1}{2}\), 2\(\frac{1}{2}\), 1\(\frac{1}{2}\), 3\(\frac{1}{2}\), 3.
The percentage of the sample spent 2 hours studying for the test are,
\(\frac{5}{20}\) × 100% = 25%
Question 4.
Based on this sample, about how many students from all of the classes spent 2 hours studying for the test?
Answer:
25
Explanation:
From the above given information above,
total students from all of the classes spent 2 hours studying for the test are:
\(\frac{1}{2}\), 1\(\frac{1}{2}\), 3, 1, 2, 3\(\frac{1}{2}\), 1, 1\(\frac{1}{2}\), 1\(\frac{1}{2}\), 2, 3\(\frac{1}{2}\), 2, 1\(\frac{1}{2}\), 2, 2, 3\(\frac{1}{2}\), 2\(\frac{1}{2}\), 1\(\frac{1}{2}\), 3\(\frac{1}{2}\), 3.
The percentage of the sample spent 2 hours studying for the test are,
\(\frac{5}{20}\)
Therefore, 25 students from all of the classes spent 2 hours studying for the test.
Question 5.
Based on this sample, about how many students from all of the classes spent at least 2\(\frac{1}{2}\) hours studying for the test?
Answer:
35
Explanation:
From the above given information above,
total number of students from all of the classes spent at least 2\(\frac{1}{2}\) hours studying for the test are:
3, 3\(\frac{1}{2}\), 3\(\frac{1}{2}\), 3\(\frac{1}{2}\), 2\(\frac{1}{2}\), 3\(\frac{1}{2}\), 3 = 7
= \(\frac{7}{20}\)
Therefore, 35 students from all of the classes spent at least 2\(\frac{1}{2}\) hours studying for the test.
Question 6.
Based on this sample, about how many students from all of the classes spent less than 2 hours studying for the test?
Answer:
40
Explanation:
From the above given information above,
total number of students from all of the classes spent less than 2 hours studying for the test are:
\(\frac{1}{2}\), 1\(\frac{1}{2}\), 1, 1, 1\(\frac{1}{2}\), 1\(\frac{1}{2}\), 1\(\frac{1}{2}\), 1\(\frac{1}{2}\) = 8
= \(\frac{8}{20}\) × 100
= 40
Therefore, 40 students from all of the classes spent less than 2 hours studying for the test.