All the solutions provided in McGraw Hill My Math Grade 3 Answer Key PDF Chapter 12 Lesson 1 Collect and Record Data will give you a clear idea of the concepts.
McGraw-Hill My Math Grade 3 Answer Key Chapter 12 Lesson 1 Collect and Record Data
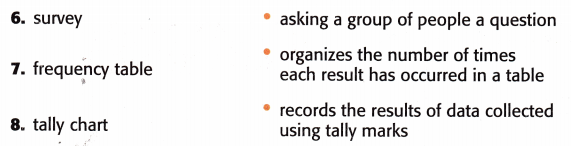
Data is collected information or facts. One way to collect data is by taking a survey, or asking a lot of people a question. A frequency table or tally chart will help you record the data you collect
Math in My World
Example 1
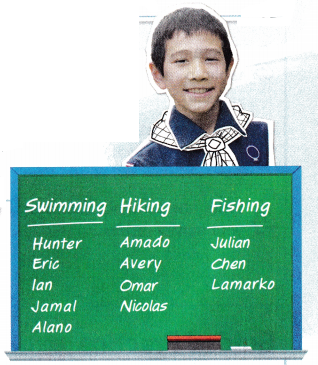
Mr. Alvarez surveyed his scout troop. He asked each of his scouts, “What is your favorite camping activity?” The results are shown. Organize the data. Complete the table.
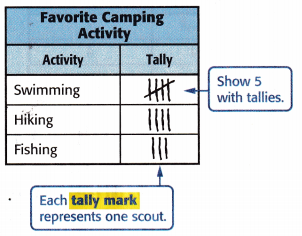
One Way:
Use a tally chart.
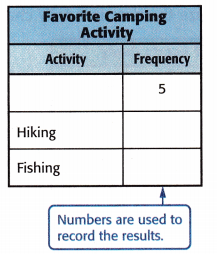
Another Way:
Use a frequency table.
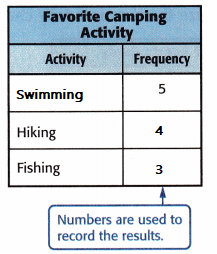
Answer:
Write one sentence about the data that was recorded.
Answer:
From Mr. Alvarez survey, we can say that swimming is the most favorite camping activity.
Example 2
Survey your classmates. Record the results.
1. Write a survey question to ask your classmates. An example is shown. Which type of lunch is your favorite?
A. grilled cheese
B. pizza
C. peanut butter and jelly sandwich
D. spaghetti
Answer:
My favorite lunch is pizza.
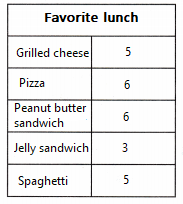
2. Create a tally chart or a frequency table to record your results.
Answer:
3. Ask the question to each of your classmates. Organize the data.
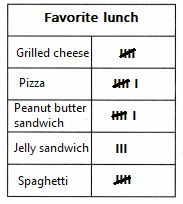
4. Write one sentence that describes your survey results.
From the survey, we can say that the same number of students like pizza and peanut butter sandwich for lunch.
Talk Math
What is the difference between a frequency table and a tally chart?

Answer:
Frequency table displays the count of the total number of times that each category of data occurs.While tally chart is drawn using horizontal stripes that represent numbers.For example, as shown in tables above, one strip is equal to number one, but when you come to five you have to put a diagonal line across the stripes.
Guided Practice
Question 1.
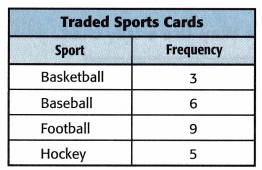
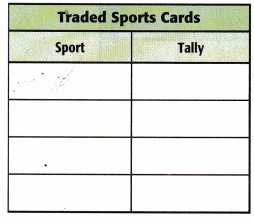
The data shows the sports cards most frequently traded in Mrs. Patton’s class. Organize the data in a tally chart.
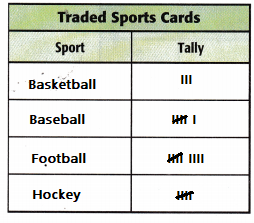
Answer:
Which is the most popular sports card to trade?
Answer:
Tallies for basketball=3
Tallies for baseball=6
Tallies for football=9
Tallies for hockey=5
From the above data,we can say that the most popular sports card to trade is football.
Which is the least popular?
Answer:
The least popular sports card is basketball.
Independent Practice
Organize each set of data in a frequency table.
Question 2.
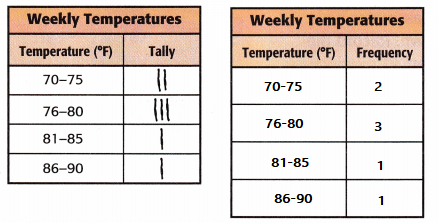
While observing temperatures for one week, Arnaldo recorded the following data.
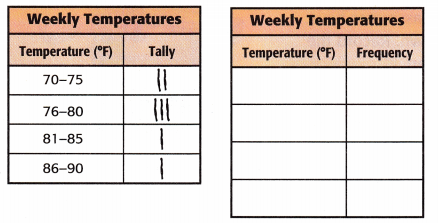
Answer:
Question 3.
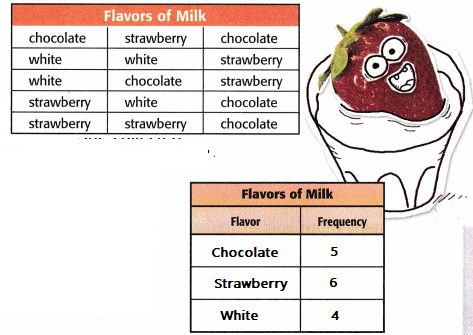
Darla observed her friends. She collected data on the flavor of milk they drank at lunch.
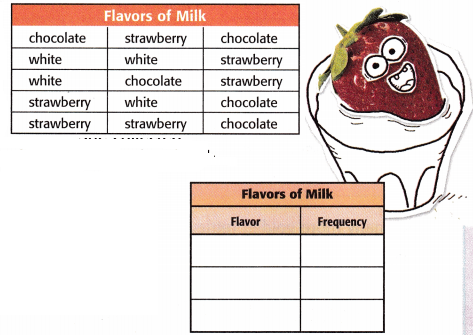
Answer:
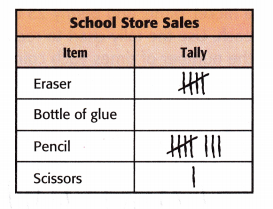
Use the tally chart to answer the questions below.
Question 4.
Which item was the top seller?
Answer:
Pencil was the top most seller among the remaning items.
Question 5.
Which item sold once?
Answer:
Scissors was sold only once.
Question 6.
How many items were sold altogether?
Answer:
The total number of items sold altogether were 5+8+1=14 items.
Problem Solving
Question 7.
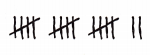
How would you represent the tallies at the right as a number in a frequency table?
Answer:
Each tally mark is equal to count of 1 and the diagonal mark drawn on four horizontal tally marks gives the count of 5 . So, the total count of above tallies will be 5+5+5+2=17.
For the above tallies, 17 number should be written in frequency table.
Question 8.
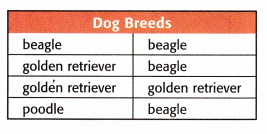
Elisa took a survey to find what breed of dog her classmates have. The results are shown. Record the data in the tally chart.
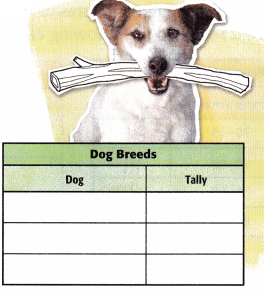
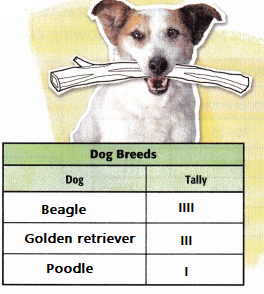
Answer:
How many classmates responded to Elisa’s survey? Explain.
Answer:
From the tally chart, we can get the total number of classmates responded to Elisa’s survey.
Each tally mark is equal to 1.
Number of classmates who own beagle dog breed = 4
Number of classmates who own golden retriever dog breed = 3
Number of classmates who own poodle dog breed = 1
Therefore, the total number of classmates responded will be 4+3+1=8.
How many more golden retrievers than poodles are owned by Elisa’s classmates?
Answer:
The number of classmates who own more golden retrievers than poodles are 3-1=2.
HOT Problems
Question 9.
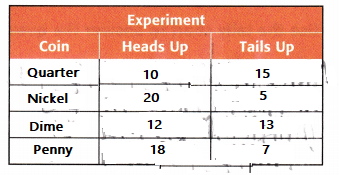
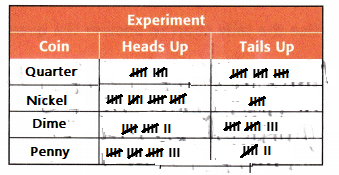
Mathematical PRACTICE Use Math Tools Experiment with tossing a quarter, a nickel, dime, and penny 25 times each. Use the tally chart to record the number of times each coin lands heads up and tails up.
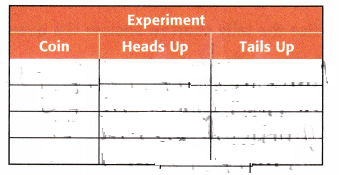
Answer:
First we will prepare a frequency table from the recordings made using the Maths Tools Experiment.
Tally Chart:
Question 10.
Building on the Essential Question What information can a tally chart and frequency table give you?
Answer:
Tally charts give the information of the count as a group of tallies. Each tally mark is equal to one, and the diagonal tally drawn on the group of 4 tallies is equal to the count of 5. So, we can say that the tally chart is a way of recording data in groups of five.
While the frequency table gives us the total count of the number of times a value occurs, it displays the data in numbers such as 1, 2, and so on.
McGraw Hill My Math Grade 3 Chapter 12 Lesson 1 My Homework Answer Key
Practice
Question 1.
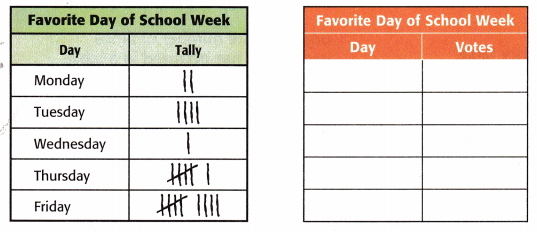
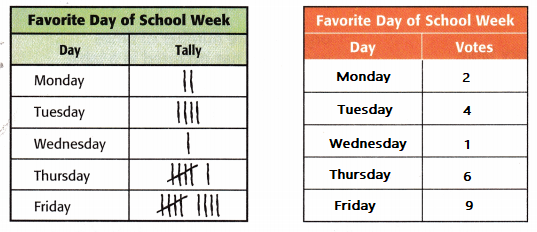
Alyssa records the results of her survey in the tally chart. Organize this data in the frequency table.
Answer:
Question 2.
Which day of the school week is the least favorite day?
Answer:
From the above data, we can say that Wednesday is the least favorite day of the school week.
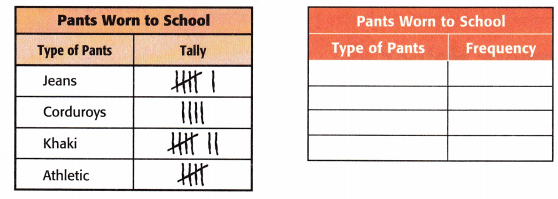
Mathematical PRACTICE Model Math For Exercises 3-5, refer to the following information. Fillipo observed the type of pants his friends wear to school.
Question 3.
Organize the set of data in a frequency table.
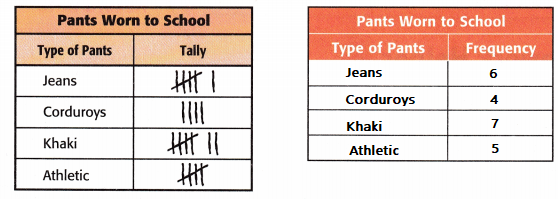
Answer:
Question 4.
How many more pairs of jeans were worn than corduroys?
Answer:
Number of friends who wore jeans = 6
Number of friends who wore corduroys = 4
Therefore, the total number of more people who wore jeans than corduroys will be 6-4=2
Question 5.
Which type of pants was worn the most that day?
Answer:
From the data above,
Number of friends who wore jeans = 6
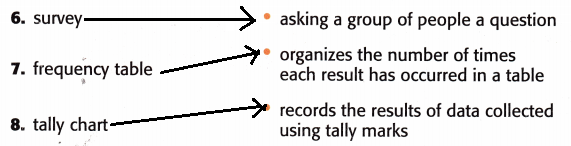
Vocabulary Check
Match each vocabulary term with its definition.
Test Practice
Question 9.
According to the tally chart, how many students participated in the survey?
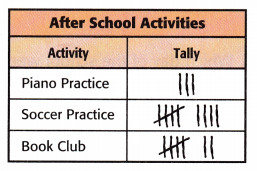
(A) 16 students
(B) 17 students
(C) 18 students
(D) 19 students
Answer:
Tallies of students for piano pratice = 3
Tallies of students for soccer pratice = 9
Tallies of students for book club = 7
The total number of students participated in the survey are 3+9+7=19
So, option D is correct.