All the solutions provided in McGraw Hill My Math Grade 3 Answer Key PDF Chapter 12 Lesson 2 Draw Scaled Picture Graphs will give you a clear idea of the concepts.
McGraw-Hill My Math Grade 3 Answer Key Chapter 12 Lesson 2 Draw Scaled Picture Graphs
In Grade 2, you used a picture graph with different pictures to represent data. A pictograph uses the same symbol to represent more than one. For this reason, it is also called a scaled picture graph.
Math in My World
Example 1
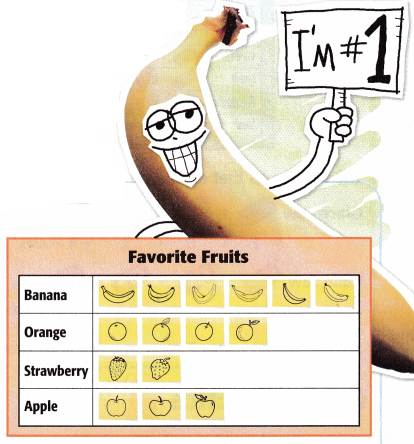
Fifteen students drew pictures of their favorite fruits on sticky notes. Their responses are shown in the picture graph. How can this data be displayed in a pictograph?
A pictograph displays the same data as a picture graph, but in a different way.
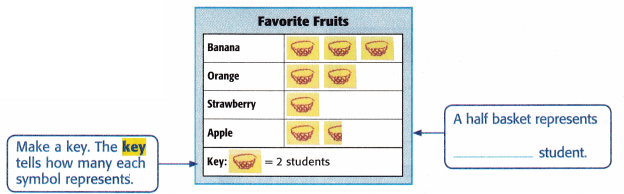
There are half as many symbols in the _________________ as the picture graph.
So, the graphs display the same set of data two different ways.
Answer:
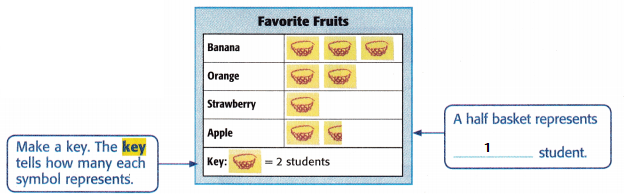
There are half as many symbols in the pictograph as the picture graph.
Example 2
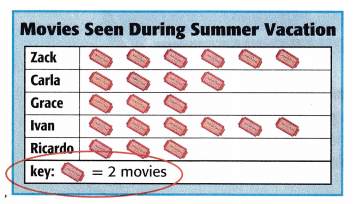
The pictograph shows the results of a survey Antoine conducted. Who saw two more movies than Grace?
The key shows that each symbol ![]() represents ____________ movies.
represents ____________ movies.
Grace saw ![]() +
+ ![]() +
+ ![]() or ________________ movies movies.
or ________________ movies movies.
Carla saw ![]() +
+ ![]() +
+ ![]() +
+ ![]() or _____________ movies.
or _____________ movies.
__________ + __________ + __________ + __________ = 8 movies
So, ____________ saw 2 more movies than Grace.
Answer:
The key shows that each symbol ![]() represents 2 movies.
represents 2 movies.
Grace saw ![]() +
+ ![]() +
+ ![]() or 6 movies movies.
or 6 movies movies.
Carla saw ![]() +
+ ![]() +
+ ![]() +
+ ![]() or 8 movies.
or 8 movies.
2 + 2 + 2 + 2= 8 movies
So, Carla saw 2 more movies than Grace.
Talk Math
Explain why a pictograph must have a key.

Answer:
A key on pictograph is used to indicate the value of a symbol.
Guided Practice
Question 1.
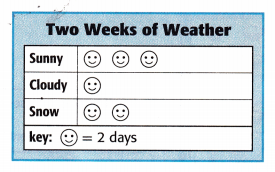
Analyze the pictograph. Then write a sentence that interprets the data.
Answer:
From the given data, we can say that the cloudy days are twice that as many as the snowy days.
The number of cloudy days is 2, and the number of snowy days is 2+2=4.
Independent Practice
Display each set of data in a pictograph. Write a sentence that interprets the data.
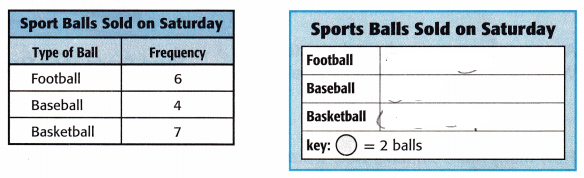
Question 2.
Answer:
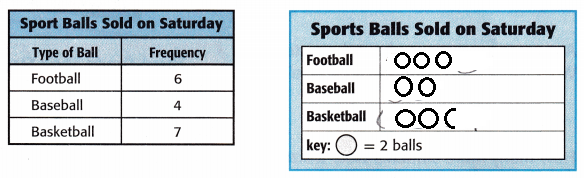
From the above data, we can say that the sales of basketball on saturday are twice that of baseball.
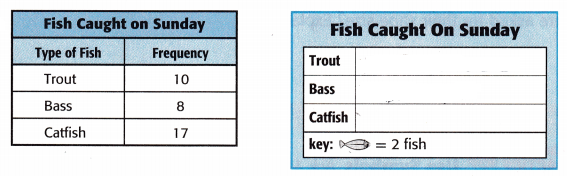
Question 3.
Answer:
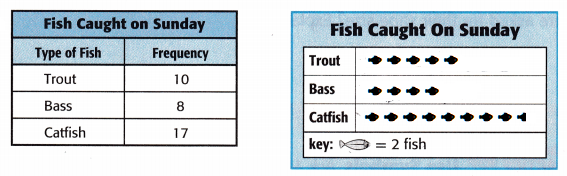
From the above data, we can say that the catfish caught is twice that of bass.
Question 4.
A barn had 6 of each animal shown below and 9 pigs.
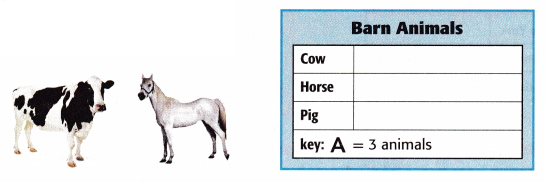
Answer:
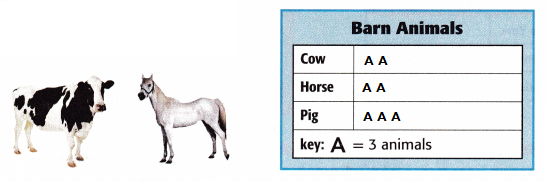
The barn has equal number of cow and horse.
Problem Solving
Question 5.
A pictograph shows 2 ![]() symbols. Each symbol represents 3 people who enjoy rock music. How many people enjoy rock music?
symbols. Each symbol represents 3 people who enjoy rock music. How many people enjoy rock music?

Answer:
A pictograph shows 2 ![]() symbols. Each symbol represents 3 people who enjoy rock music. So, 3+3 =6 people will enjoy rock music.
symbols. Each symbol represents 3 people who enjoy rock music. So, 3+3 =6 people will enjoy rock music.
Question 6.
Answer the questions about the pictograph. What is the most common shoe size?
Answer:
The most common shoe size is size 6.
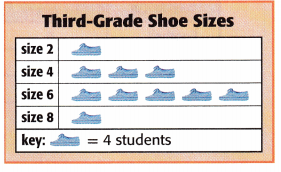
How many more students wear a size 4 shoe size than wear a size 8 shoe size?
Number of students who wear size 4 is 4+4+4=12
Number of students who wear size 8 is 4
12-4=8 students wear a size 4 shoe size than size 8 shoe size.
Mathematical PRACTICE Explain to a Friend How many students were asked for their shoe size? Explain.
Answer:
Number of students who wear size 2 is 4
Number of students who wear size 4 is 4+4+4=12
Number of students who wear size 6 is 4+4+4+4+4=20
Number of students who wear size 8 is 4
Thereforee, the total number of students who were asked for their shoe size will be 4+12+20+4=40
HOT Problems
Question 7.
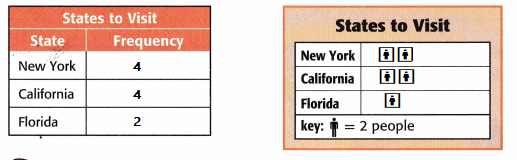
Mathematical PRACTICE Use Symbols Ask 10 people which of the three states they would most like to visit. Record the data in a frequency table and display it in a pictograph.
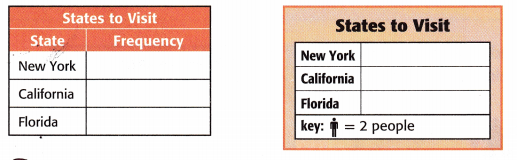
Answer:
Question 8.
Building on the Essential Question What is the difference between a picture graph and a pictograph?
Answer:
A picture graph represents the data using actual item images while a pictograph represents the items being graphed.
McGraw Hill My Math Grade 3 Chapter 12 Lesson 2 My Homework Answer Key
Practice
Question 1.
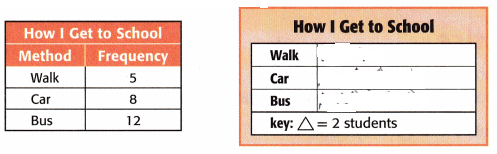
Display the set of data in a pictograph. Then write a sentence that interprets the data.
Answer:
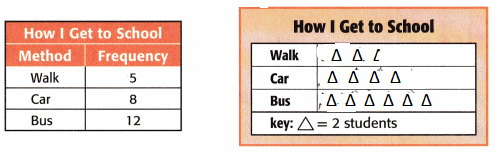
Most of the time I get to school by bus.
Question 2.
Display the set of data in a pictograph. Write a sentence that interprets the data.
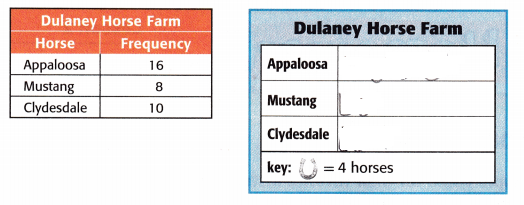
Answer:
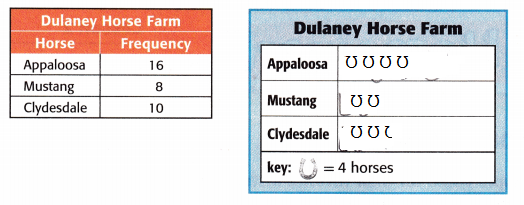
Dulaney’s house farm has Appaloosa horse twice that of Mustang horse.
Problem Solving
Question 3.
Mathematical PRACTICE Understand Symbols A pictograph key shows 3 symbols. Each symbol represents 7 hikers in the mountains. How many hikers are in the mountains altogether?
Answer:
Given data: A pictograph key shows 3 symbols. Each symbol represents 7 hikers in the mountains.
To calculate the total number of hikers, multiply 3 with 7 as each symbol represents 7 hikers.
So, the total hikers in the mountains will be 3×7=21
Vocabulary Check
Choose the correct word(s) to complete each sentence.
picture graph
pictograph
key
analyze
interpret
Question 4.
To ______________ is to read or study the data on a graph.
Answer:
To analyze is to read or study the data on a graph.
Question 5.
The ______________ in the graph tells how many each symbol stands for.
Answer:
The key in the graph tells how many each symbol stands for.
Question 6.
A _____________ uses the same symbol to represent more than one vote or tally.
Answer:
A pictograph uses the same symbol to represent more than one vote or tally.
Test Practice
Question 7.
A pictograph key shows that each  symbol equals 6 movies. How many symbols equal 18 movies?
(A) 2 symbols
(B) 3 symbols
(C) 4 symbols
(D) 5 symbols
Answer:
Each symbol equals 6 movies.
Therefore, the symbols which will be equal to 18 movies will be 18÷6=3.
So,option B is correct.