All the solutions provided in McGraw Hill My Math Grade 2 Answer Key PDF Chapter 9 Lesson 7 Make Line Plots will give you a clear idea of the concepts.
McGraw-Hill My Math Grade 2 Answer Key Chapter 9 Lesson 7 Make Line Plots
Explore and Explain
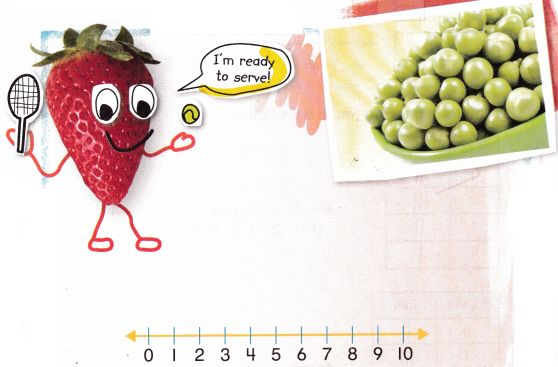
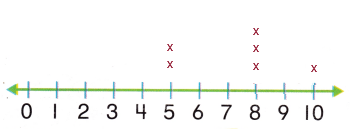
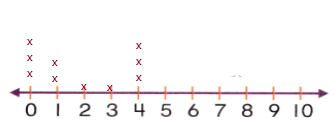
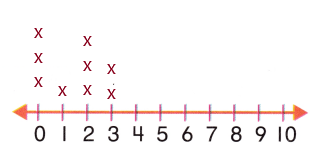
Teacher Directions: Chose asked 10 students how many servings of fruits and vegetables they eat each day. Three people eat 2 servings. Draw 3 X’s over the number 2. Six people eat 5 servings. Draw 6 X’s over the number 5. One person eats 7 servings. Draw 1 X over the number 7,
Answer: 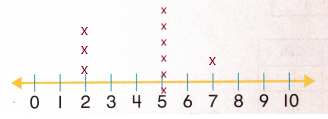
See and Show
A line plot is a way to organize data. Line plots are used to see how often a certain number occurs in data.
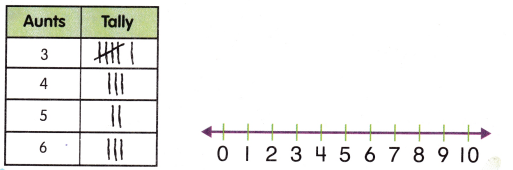
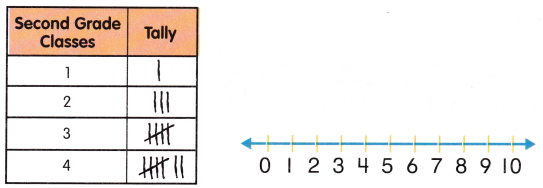
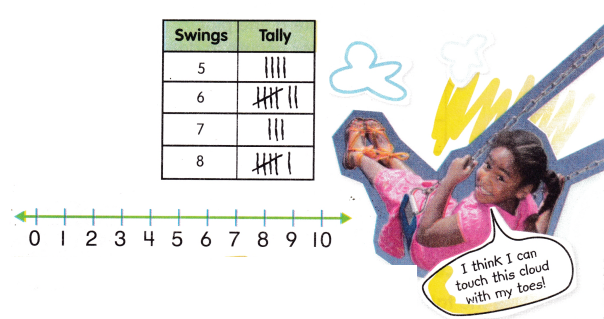
Mr. Sun’s students marked their ages on a tally chart. They made a line plot using the data.
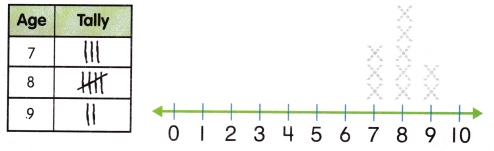
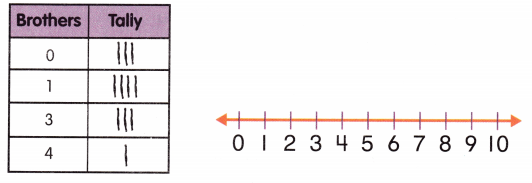
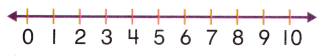
Use the tally chart to make a line plot.
Question 1.
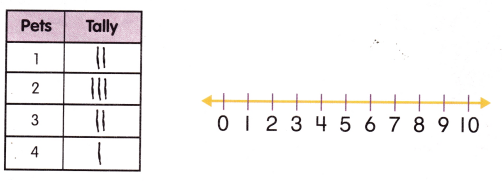
Answer: 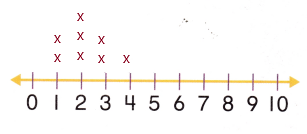
Question 2.
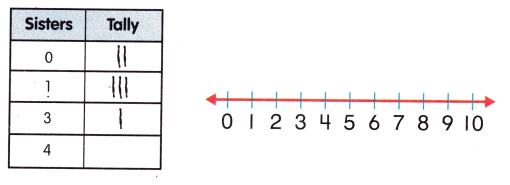
Answer: 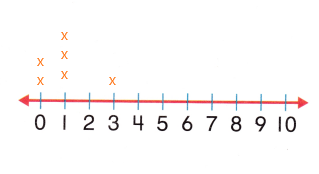
Talk Math How are line plots similar to tally charts?
Answer: A line graph—also known as a line plot or a line chart—is a graph that uses lines to connect individual data points.
Tally charts – A tally chart is a table used for counting and comparing the numbers of multiple classes of a data set.
On My Own
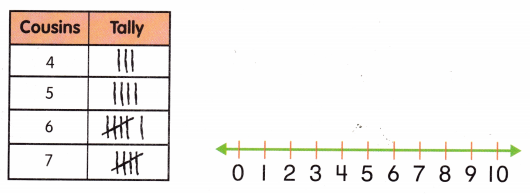
Use the tally chart to make a line plot.
Question 3.
Answer: 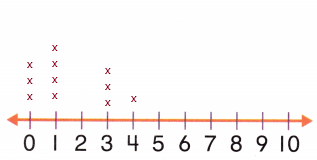
Question 4.
Answer: 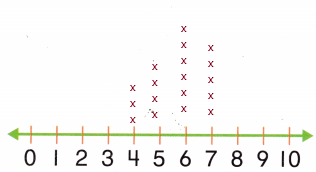
Question 5.
Answer: 
Problem Solving
Use the data to make a line plot.
Question 6.
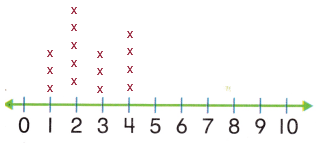
Eli asked 10 classmates how many glasses of water they drink each day. Two people said I. Three people said 0. Three people said 4. Everyone else said 6.
Answer: The detailed line plot is given below.
Explanation:
Given, Two people said I. Three people said 0.
Three people said 4. Everyone else said 6.
Question 7.
Sydney asked 15 friends how many times they exercise each week. The same number of people said I time and 3 times. Five people said 2 times. Four people said 4 times.

Answer: The detailed explanation is given below
Explanation:
Given, The same number of people said I time and 3 times.
Five people said 2 times. Four people said 4 times.
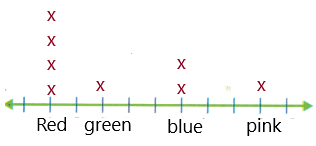
Write Math Can you use a line plot to show data about favorite color?
Answer: Yes
Explanation:
For example, we asked 8 friends of their favorite color, 2 of them said blue color and 4 of them said red and 1 said green and 1 said pink.
McGraw Hill My Math Grade 2 Chapter 9 Lesson 7 My Homework Answer Key
Practice
Use the tally chart to make a line plot.
Question 1.

Answer: the detailed plot is given below
Explanation:
We used the tally chart to get a line plot
Question 2.
Answer: 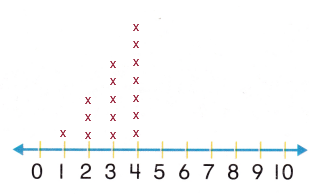
Question 3.
Answer: 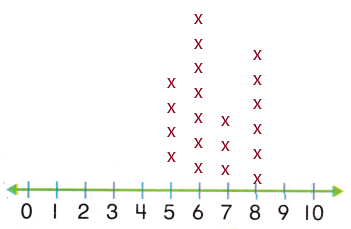
Vocabulary Check
Question 4.
Circle the line plot.
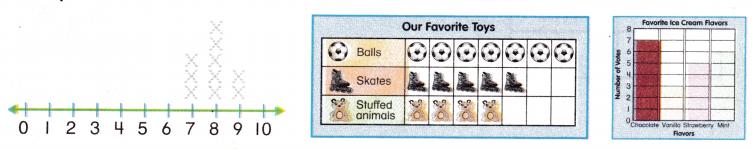
Answer: 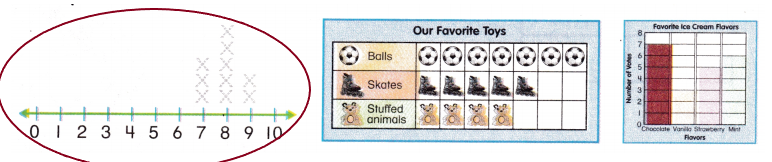
Math at Home Help your child take a survey of the ages of his or her cousins. Have your child make a line plot to show the data.
Answer: The detailed example is given below.
Explanation:
For example, there are 6 cousins whose ages are 2 of them have 5 years, 3 of them are of 8 years and 1 is 10 years old
Then the line plot will be