All the solutions provided in McGraw Hill My Math Grade 1 Answer Key PDF Chapter 7 Lesson 1 Tally Charts will give you a clear idea of the concepts.
McGraw-Hill My Math Grade 1 Answer Key Chapter 7 Lesson 1 Tally Charts
Explore and Explain

____________ – ____________ = _____________ more people
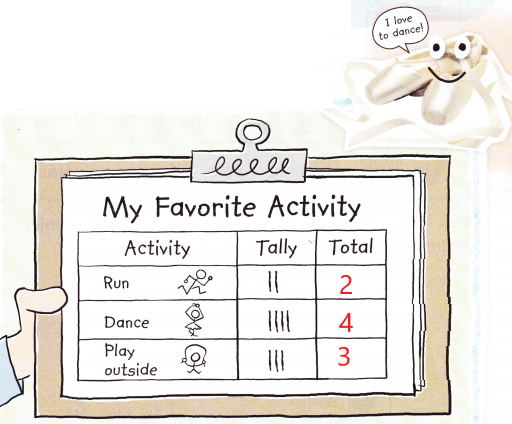
Teacher Directions: Use ![]() to show the number of people who voted for each activity. Write each total. How many more people like to dance than to run? Write a subtraction number sentence to solve.
to show the number of people who voted for each activity. Write each total. How many more people like to dance than to run? Write a subtraction number sentence to solve.
Answer:
Explanation:
2 people voted for run activity
4 people chose dance activity
3 people chose play out side activity
4 – 3 = 1 is the subtraction number sentence
1 person voted for dance more than to run.
See and Show
A tally chart shows a mark for each vote in a survey. A survey asks people the same question.
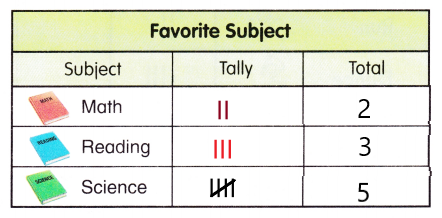
Ask 10 friends to choose their favorite school subject. Make a tally chart. Write the totals. Use the tally chart. How many chose each subject?

Answer:
Question 1.
![]()
Answer:
2
Explanation:
2 people chose Math as their favorite subject
Question 2.

Answer:
3
Explanation:
3 people chose Reading as their favorite subject
Question 3.
![]()
Answer:
5
Explanation:
5 people chose Reading as their favorite subject
Talk Math How are tally marks used to take surveys?
Answer:
10 tally marks are used to take surveys.
On Your Own
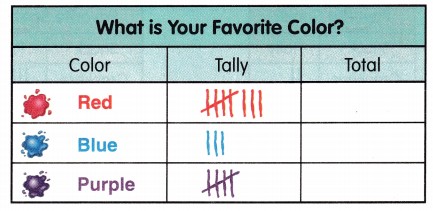
Write the totals. Use the chart to answer the questions.
Answer:
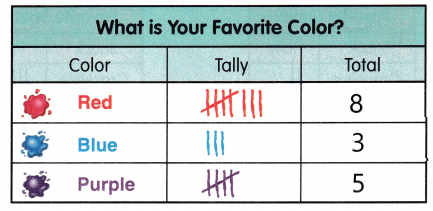
Question 4.
How many people chose red?
Answer:
8
Explanation:
8 people chose red color as their favorite color.
Question 5.
How many people chose purple?
Answer:
5
Explanation:
5 people chose purple as their favorite color.
Question 6.
Do more people like purple or blue?
Answer:
purple
Explanation:
3 people chose blue as their favorite color
5 people chose purple as their favorite color
5 > 3
So, more people chose purple color.
Question 7.
How many more people like red than blue?
Answer:
5
Explanation:
8 people chose red color as their favorite color
3 people chose blue as their favorite color
8 – 3 = 5
So, 5 people like red than blue.
Question 8.
Do more people like red or purple?
Answer:
red
Explanation:
8 people chose red color as their favorite color
5 people chose purple as their favorite color
8 > 5
So, more people chose red color.
Question 9.
How many fewer people like blue than purple?
Answer:
2
Explanation:
3 people chose blue as their favorite color
5 people chose purple as their favorite color
5 – 3 = 2
So, 2 fewer people chose blue than purple.
Question 10.
How many people were surveyed in all?
Answer:
16
Explanation:
8 people chose red color as their favorite color
3 people chose blue as their favorite color
5 people chose purple as their favorite color
Add 8, 3, 5
8 + 3 + 5 = 16
So, 16 people are surveyed.
Problem Solving
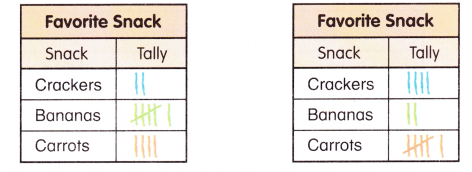
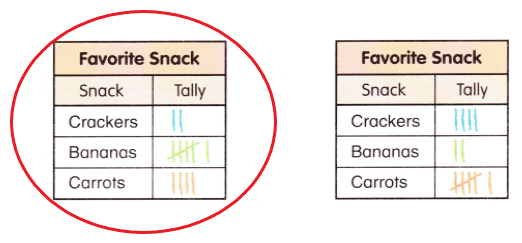
Question 11.
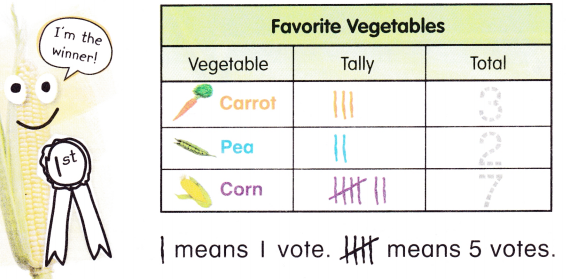
Circle the tally chart that shows 2 students like crackers, 6 students like bananas, and 4 students like carrots.
Answer:
Explanation:
The first tally chart shows 2 students like crackers, 6 students like bananas, and 4 students like carrots
So, i drew a circle around first tally chart.
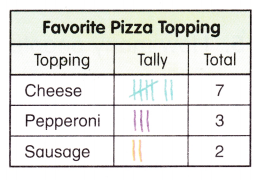
HOT Problem! Samantha is having a pizza party. She asks her guests to pick their favorite kind of pizza. If she orders one kind which one does she order? Explain.
Answer:
Samantha is having a pizza party
She asks her guests to pick their favorite kind of pizza
7 chose Cheese pizza
3 chose Pepperoni pizza
2 chose Sausage pizza
She orders one kind that is chose by more number of people
7 people chose Cheese pizza and it is the greater number
So, Samantha orders Cheese Pizza.
McGraw Hill My Math Grade 1 Chapter 7 Lesson 1 My Homework Answer Key
Practice
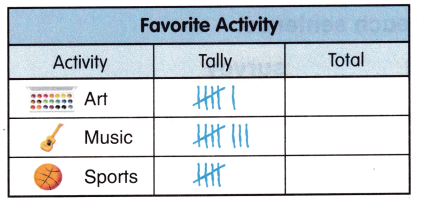
Write the totals. Use the chart to answer the questions.
Answer:
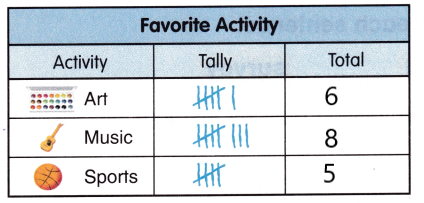
Question 1.
How many more votes did music get than art?
Answer:
2
Explanation:
8 people voted for Music as their favorite activity
6 people voted for Art as their favorite activity
8 – 6 = 2
So, music got 2 more votes than art.
Question 2.
How many people were surveyed?
Answer:
Answer:
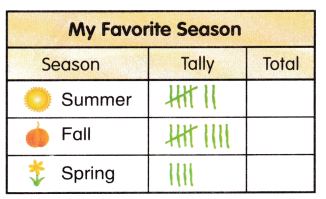
Question 3.
How many people like fall?
Answer:
9
Explanation:
9 people chose fall as their favorite season
Question 4.
How many more people like summer than spring?
Answer:
3
Explanation:
7 people chose summer as their favorite season
4 people chose spring as their favorite season
7 – 4 = 3
3 more people like summer than spring.
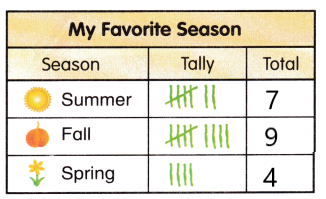
Question 5.
Do 7 people like summer or fall?
Answer:
7
Explanation:
7 people chose summer as their favorite season.
Question 6.
How many people were surveyed?
Answer:
20 people
Explanation:
7 people chose summer as their favorite season
9 people chose fall as their favorite season
4 people chose spring as their favorite season
Add to find the total
7 + 9 = 4 = 20
So, 20 people were surveyed.
Vocabulary Check
Complete each sentence.
tally chart
survey
Question 7.
You can collect data by taking a _______________.
Answer:
You can collect data by taking a survey.
Question 8.
A _______________ shows data using tally marks.
Answer:
A tally char shows data using tally marks.
Math at Home Ask your child to make a tally chart to show which sport your family likes better: football or baseball.
Answer: