We included HMH Into Math Grade 8 Answer Key PDF Module 6 Lesson 1 Understand and Graph Functions to make students experts in learning maths.
HMH Into Math Grade 8 Module 6 Lesson 1 Answer Key Understand and Graph Functions
I Can graph a function given a table, and identify a function given a table or a graph.
Spark Your Learning
Gina is purchasing a mobile device. The graph represents Gina’s total cost of owning a device for the first year. What can you interpret about her costs from the graph?

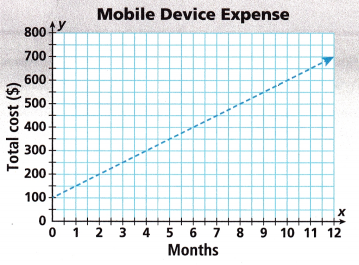
Turn and Talk The graph shows the cost for 12 months. How can you determine the cost for 13 or more months?
Build Understanding
A function is a rule that assigns exactly one output to each input. Multiple inputs may have the same output value, but one input value may not have multiple output values.
The set of all possible input values of a function is the domain.
The set of all possible output values of a function is the range.
Connect to Vocabulary
A relation is any set of Paired input and output values.
1. A. Gina’s cost, rounded to the nearest dollar, to operate a mobile device is a function. Gina’s cost accumulates over the number of months she has the account, so months are the input for the function. Since the function’s domain is defined by its input, what is the domain of this function? Why?
Answer: The domain of this function is months.
B. The total cost is the output of the function, which is the function’s range. What is the range of the function? Why?
Answer: The range of the function is cost.
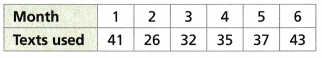
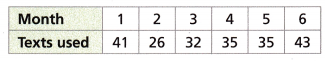
C. Gina’s plan includes up to 50 free texts in the monthly fee. Does this table show a function? Explain.
Answer:
Yes, the given table is a function.
D. The number of texts for month 5 is accidentally changed to be the same as for month 4. Does the table show a function? Explain.
Answer:
The given table is not a function, because one input value may not have multiple output values.
E. If the 2 in the Month row is accidentally changed to a 1, does the table show a function? Explain.
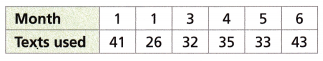
Answer: No, because the input values are the same.
Turn and Talk Explain in your own words the difference between a function and a relation.
Answer:
The difference between a relation and a function is that a relationship can have many outputs for a single input, but a function has a single input for a single output.
Step It Out
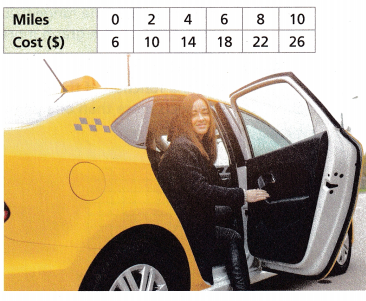
2. Erin is taking a taxi to a destination no more than 10 miles away. The cost of the taxi ride is $6.00 to be picked up and an additional $2.00 per mile (prorated for partial miles).
A. Describe the domain.
The domain is the number of miles from
____ to _____
Answer:
The domain is the number of miles from
0 to 10
B. Describe the range.
The minimum charge is the charge for 0 miles, ____. The cost for 10 miles is ___.
The range is the numbers of dollars from ___ to ___.
Answer:
The minimum charge is the charge for 0 miles, $6. The cost for 10 miles is $26.
The range is the numbers of dollars from 0 to 26.
C. The x-axis scale is based on the (domain / range) and should include values from ___ to ___. The y-axis scale is based on the (domain / range) and should include values from ___ to ____
Answer:
The x-axis scale is based on the domain and should include values from 0 to 10. The y-axis scale is based on the range and should include values from 0 to 26.
D. Plot the data in the table on the coordinate grid using the values in the table as ordered pairs, and draw a line through the plotted points. Miles are the input to the function and represented as x, and cost is the output of the function and represented by y in the ordered pair.
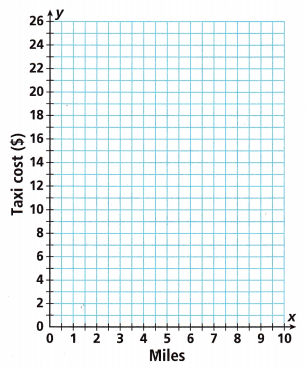
Answer:
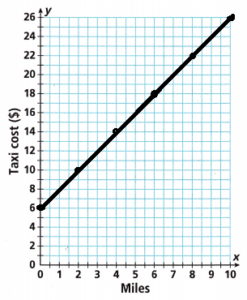
E. If Erin’s taxi ride is 7 miles, how much will the taxi ride cost? Explain.
Answer:
By seeing the above graph we can say that if Erin’s taxi ride is 7 miles then cost of taxi ride is $20.
Turn and Talk If Erin paid $24, how many miles was her taxi ride? Explain.
Answer:
By seeing the above graph we can say that, If Erin paid $24 then the taxi ride was 9 miles.
The vertical line test can help determine whether a graph is a function or not by visually identifying where a single domain value is associated with more than one range value. If any vertical line can be drawn that passes through the graph more than once, the graph is not a function.
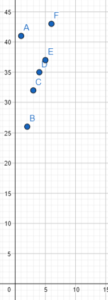
3. For each plot, use the vertical line test to determine whether the plot shows a function. If the plot is not a function, draw a vertical line that intersects more than one point on the graph.
A. 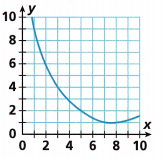
The graph (is/is not) a function.
Answer: The graph is a function.
A vertical line test is a graphical test method that is used to determine whether the given graph is a function or not.
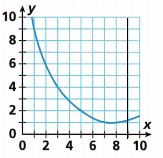
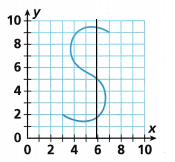
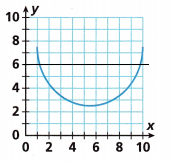
B. 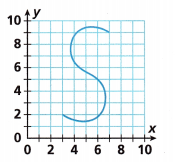
The graph (is/is not) a function.
Answer: The graph is not a function.
A vertical line test is a graphical test method that is used to determine whether the given graph is a function or not.
C. 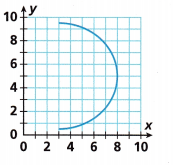
The graph (is/is not) a function.
Answer: The graph is not a function.
A vertical line test is a graphical test method that is used to determine whether the given graph is a function or not.
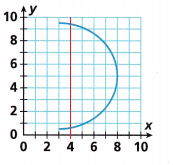
D. 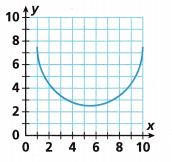
The graph (is/is not) a function.
Answer: The graph is not a function.
A vertical line test is a graphical test method that is used to determine whether the given graph is a function or not.
Check Understanding
Question 1.
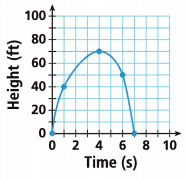
The function plotted represents the path of an object launched into the air. The object rises, then falls to the ground. From the graph, what are the domain, the range, and the coordinates of the points indicated on the graph?
Domain: _______
Range: _____
Coordinates: ______
Answer:
Domain: [0, 7]
Range: 0 to 70
The coordinates are (0, 0), (1, 40), (4, 70), (6, 50) and (7, 0)
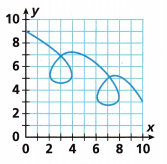
Question 2.
Does the oval graph represent a function? Why or why not?
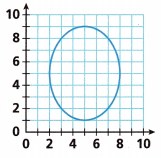
Answer:
No, because the graph does not pass the vertical line.
So, it does not represent the function.
On Your Own
Question 3.
Rico has a mobile device plan that charges a $4 monthly fee. He is also charged $0.30 per minute for calls.
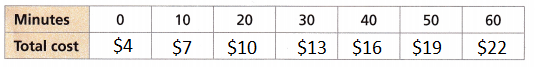
A. Fill in the table for the total cost per month for Rico to use his device for the given number of minutes.
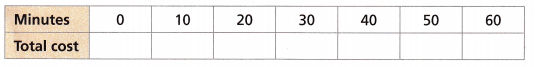
Answer:
Given,
Rico has a mobile device plan that charges a $4 monthly fee. He is also charged $0.30 per minute for calls.
0 × 0.30 + 4 = $4
10 × 0.30 + 4 = 3 + 4 = $7
20 × 0.30 + 4 = 6 + 4 = $10
30 × 0.30 + 4 = 9 + 4 = $13
40 × 0.30 + 4 = 12 + 4 = $16
50 × 0.30 + 4 = 15 + 4 = $19
60 × 0.30 + 4 = 18 + 4 = $22
B. What is the domain of the function for Rico’s mobile plan?
__________________
Answer: The domain of the function for Rico’s mobile plan is [0, 60]
Question 4.
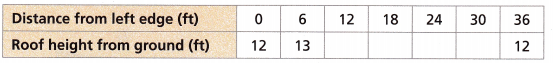
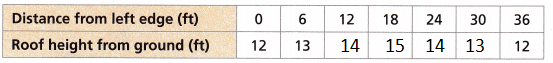
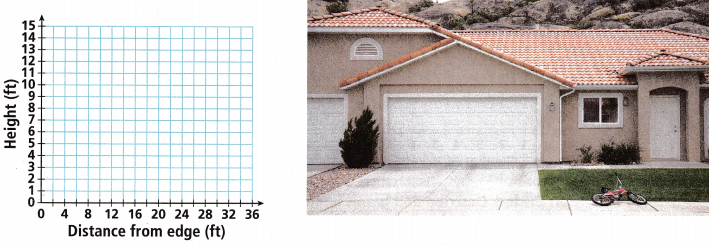
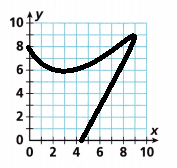
STEM An architect proposes a roof 36 feet wide that rises 1 foot for every 6 feet to its center, then sinks at the same rate to its end. The table shows the height of the roofline if its base is 12 feet high.
A. Complete the table.
Answer:
Given,
An architect proposes a roof 36 feet wide that rises 1 foot for every 6 feet to its center, then sinks at the same rate to its end.
0ft = 12
6 = 13 ft
12 = 14 ft
18 = 15ft
24 = 14ft
30 = 13 ft
B. Plot the graph of the roofline’s height from the data in the table.
Answer:
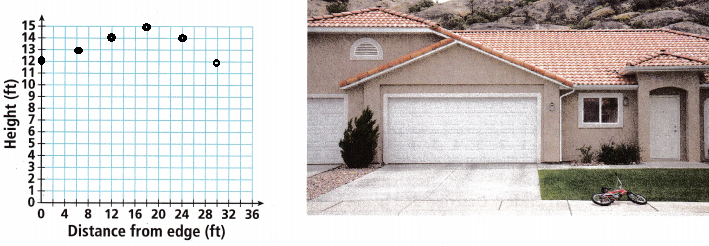
C. What is the range of the function representing the roofline?
____________________
Answer: Range is 12 to 15
D. What is the domain of the function representing the roofline?
____________________
Answer: Domain is [0, 36]
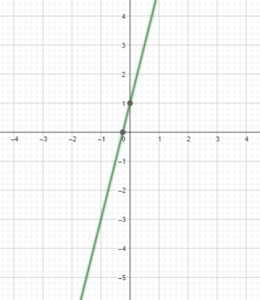
Question 5.
Use Structure If the domain of the function y = 4x + 1 is 0 ≤ x ≤ 10, what is the function’s range? (Hint: Graph the line.)
__________________
Answer:
Reason For Problems 6—7, determine whether the graph is a function and explain your reasoning.
Question 6.
Answer:
x- value = {0, 3, 5, 8, 10}
y-values = {6, 2, 7, 1, 4}
The graph is a function because for each input there is only one output value.
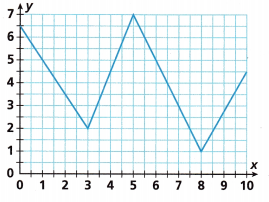
Question 7.
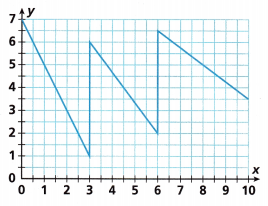
Answer:
x-values = {0, 3, 3, 6, 6, 10}
y-values = {7, 1, 6, 2, 6.5, 3.5}
It is not a function.
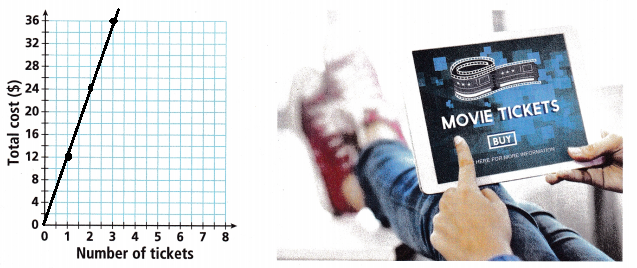
Question 8.
Emir is ordering movie tickets online for himself and up to three of his coworkers for an upcoming show. The ordering fee is $4 and the cost per ticket is $8. Plot the function that represents the total cost of the tickets.

Answer:
Question 9.
Open Ended Describe and graph a real-life situation that would represent a function.
Answer:
I’m in a Learning Mindset!
How was identifying a function on a graph an appropriate challenge for me?
_________________________
_________________________
Lesson 6.1 More Practice/Homework
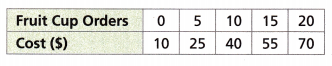
Use the information to answer Problems 1-3.
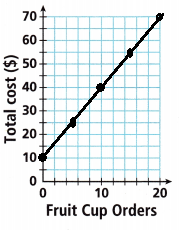
Mrs. Aviles is planning a fruit-cup party for a class of 18 students and two teachers. She spends $10 for a package of snacks and also takes orders in advance for fruit cups that cost $3 each.
Question 1.
Describe the domain of the function both in words and numbers.
__________________
__________________
Answer:
Fruit cup orders are between 0 and 20.
Domain = [0, 20]

Question 2.
What is the range of the function?
__________________
Answer:
Range is between $10 and $70
Range = [10, 70]
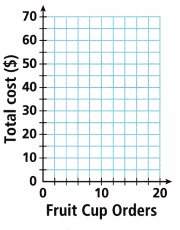
Question 3.
Plot the data shown in the table on the coordinate plane. If the data are continuous, draw a solid line through the plotted points.
Answer:
Use the graph to answer Problems 4-5.
Question 4.
Construct Arguments Does the graph represent a function? Explain.
Answer:
Question 5.
Name a section of the graph that, taken in isolation, is a function.
Answer:
Question 6.
Open Ended Draw a graph that does not represent a function.
Answer:
Test Prep
Question 7.
Athar is buying hats for his baseball team. The shipping charge is $5, and each hat costs $8. There are ten people on his baseball team. The graph shows the total cost of the hats. Select all true statements.
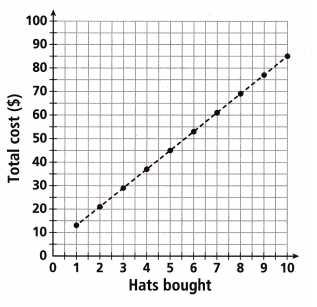
A. The ordered pair for 1 hat bought is (1, 8).
B. The domain is whole numbers of hats from 1 to 10.
C. The range is numbers of dollars from 0 to 100 in increments of 5.
D. The ordered pair for 5 hats bought is (5, 45).
E. The cost of ordering 10 hats is double the cost of ordering 5 hats.
Answer:
A. The ordered pair for 1 hat bought is (1, 8).
D. The ordered pair for 5 hats bought is (5, 45).
Question 8.
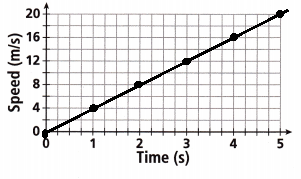
An engineer is launching a rocket and is measuring its speed when launched. The table shows the speed for the first five seconds. Plot the data in the provided coordinate plane.
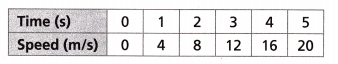
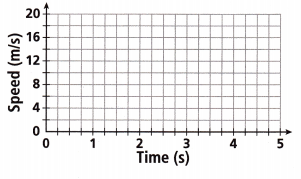
Answer:
Spiral Review
Question 9.
What is the unit rate for the proportional relationship represented in the graph?
Answer:
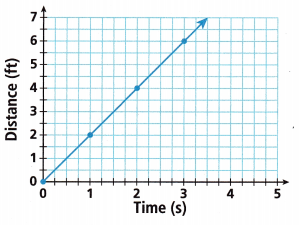
The ordered pairs are (1, 2), (2, 4) and (3, 6)
Unit rate = (4-2)/(2-1) = 2/1 = 2
t = 1 and distance = 2 feet
Question 10.
If the slope of a proportional relationship is 3, what is the equation that represents that line?
Answer:
Given that the slope is 3.
A proportional function has the equation.
y = mx
where m = 3
y = 3x
Question 11.
Gretchen is delivering boxes of cookies to her neighbors. Her wagon itself weighs 12 pounds when empty and will hold up to 9 boxes. If each box of cookies weighs 1 pound, what is the range of the total weight of her wagon while she is delivering cookies?
Answer:
Given,
Gretchen is delivering boxes of cookies to her neighbors. Her wagon itself weighs 12 pounds when empty and will hold up to 9 boxes.
1 (9 – 12) = -3
The range of the total weight of her wagon, while she is delivering cookies, is -3.