We included HMH Into Math Grade 7 Answer Key PDF Module 13 Use Statistics and Graphs to Compare Data to make students experts in learning maths.
HMH Into Math Grade 7 Module 13 Answer Key Use Statistics and Graphs to Compare Data
And the Best Player Is…
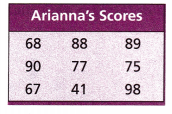
Three friends have a tournament to see who is best at playing a popular game on their phones. They each play the game 9 times. Their scores are shown.

Find the mean, median, range, and interquartile range for each player. Who is the best player?
A.
Mean: _____________
Median: ____________
Range: ___________
Interquartile range: ___________
Answer:
Given Data,
68, 88, 89, 90, 77, 75, 67, 41, 98
Mean:
Mean = Sum of observations/Number of observations
Mean = (68+88+89+90+77+75+67+41+98)/9
Mean = 77
Median:
Arrange from least to the greatest
41, 67, 68, 75, 77, 88, 89, 90, 98
The middle of the given data is the median.
Median = 77
Mode:
There are no repeated numbers in the given data.
So, the mode is 0.
The interquartile range formula is the first quartile subtracted from the third quartile: IQR = Q3 – Q1.
Q1 = 67.5
Q2 = 77
Q3 = 89.5
IQR = Q3 – Q1.
IQR = 89.5 – 67.5 = 22
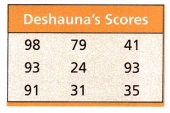
B.
Mean: _____________
Median: ____________
Range: ___________
Interquartile range: ___________
Answer:
Given Data,
98, 79, 41, 93, 24, 93, 91, 31, 35
Mean = Sum of observations/Number of observations
Mean = 98+79+41+93+24+93+91+31+35/9
Mean = 65
Median:
Arrange from least to the greatest
24, 31, 35, 41, 79, 91, 93, 93, 98
79 is the median of the given data
Mode:
93 is repeated 2 times.
So, Mode is 93.
The interquartile range formula is the first quartile subtracted from the third quartile: IQR = Q3 – Q1.
Q1 = 33
Q2 = 79
Q3 = 93
IQR = Q3 – Q1.
IQR = 93 – 33 = 60
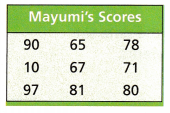
C.
Mean: _____________
Median: ____________
Range: ___________
Interquartile range: ___________
Answer:
Given data,
90, 65, 78, 10, 67, 71, 97, 81, 80
Mean:
Mean = Sum of observations/Number of observations
Mean = (10+65+67+71+78+80+81+90+97)/9
Mean = 71
Median:
Arrange from least to the greatest
10, 65, 67, 71, 78, 80, 81, 90, 97
78 is the median of the given data.
Mode:
There are no repeated numbers in the given data.
So, the mode is 0.
IQR:
The interquartile range formula is the first quartile subtracted from the third quartile: IQR = Q3 – Q1.
Q1 = 66
Q2 = 78
Q3 = 85.5
IQR = Q3 – Q1.
IQR = 85.5 – 66 = 19.5
Turn and Talk
Which player do you think is the best player? Justify your answer.
Answer: Player A is the best because the mean is highest compared to player B and player C.
Are You Ready?
Complete these problems to review prior concepts and skills you will need for this module.
Mean
Find the mean of each set of data.
Question 1.
The table lists the weights of a random sample of 11 tents from an outdoor store. What is the mean weight?
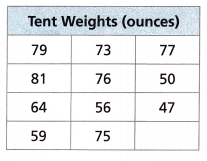
Answer:
Given data,
79, 73, 77, 81, 76, 50, 64, 56, 47, 59, 75
number of observations = 11
Mean = Sum of observations/Number of observations
Mean = (79+73+77+81+76+50+64+56+47+59+75)/11
Mean = 67
Thus the mean weight is 67.
Question 2.
17, 25, 22, 18, 18, 20 ____________
Answer:
Given data,
17, 25, 22, 18, 18, 20
number of observations = 6
Mean = Sum of observations/Number of observations
Mean = (17+25+22+18+18+20)/6
Mean = 20
Question 3.
48, 12, 35, 57, 42, 15, 74, 29 ____________
Answer:
Given data,
48, 12, 35, 57, 42, 15, 74, 29
Mean = Sum of observations/Number of observations
Number of observations = 8
Mean = (48+12+35+57+42+15+74+29)/8
Mean = 39
Question 4.
24, 27, 29, 31, 8, 16, 24, 19, 11 ____________
Answer:
Given data,
24, 27, 29, 31, 8, 16, 24, 19, 11
Number of observations = 9
Mean = Sum of observations/Number of observations
Mean = (24+27+29+31+8+16+24+19+11)/9
Mean = 21
Dot Plots
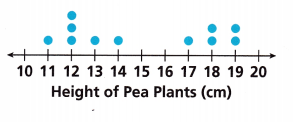
Rosa is growing pea plants for a science experiment. The dot plot shows the heights of her 11 plants. Use the dot plot to determine each measure of center or variability.
Question 5.
Mean _____________
Answer:
Given data,
11, 12, 12, 12, 13, 14, 17, 18, 18, 19, 19
Number of observations = 11
Mean = Sum of observations/Number of observations
Mean = (11+12+12+12+13+14+17+18+18+19+19)/11
Mean = 165/11 = 15
Question 6.
Median ____________
Answer:
Given data,
11, 12, 12, 12, 13, 14, 17, 18, 18, 19, 19
Number of observations = 11
Median = 14
Question 7.
Range _____________
Answer:
Given data,
Highest = 19
Lowest = 11
Range = 19 – 11 = 8
Box Plots
A karate studio offers 10 classes per week for middle school students. The numbers of students in the classes are listed below.
13, 15, 14, 10, 12, 10, 13, 16, 15, 13
Question 8.
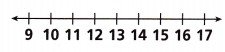
Use the number line to make a box plot of the data set. Be sure to label what the number line represents.
Answer:
Given data,
A karate studio offers 10 classes per week for middle school students.
Question 9.
Median _____________
Answer:
Given data,
13, 15, 14, 10, 12, 10, 13, 16, 15, 13
Number of observations = 10
Arrange the given data in the ascending order.
10, 10, 12, 13, 13, 13, 14, 15, 15, 16
Median = (13+13)/2 = 13
Median = 13
Question 10.
Range _____________
Answer:
Given data,
13, 15, 14, 10, 12, 10, 13, 16, 15, 13
Number of observations = 10
Highest = 16
Lowest = 10
Range = 16 – 10 = 6
Question 11.
Interquartile range _____________
Answer:
Given data,
Q1 = 12
Q2 = 13
Q3 = 15
Interquartile range = Q3 – Q1
IQR = 15 – 12
Interquartile range = 3