We included HMH Into Math Grade 7 Answer Key PDF Module 12 Lesson 3 Make Inferences from Repeated Random Samples to make students experts in learning maths.
HMH Into Math Grade 7 Module 12 Lesson 3 Answer Key Make Inferences from Repeated Random Samples
I Can calculate sample ratios, and I can make inferences about the populations from the samples.
Step It Out
Question 1.
The results of a school-wide survey of all students at a middle school about renaming the school mascot to Bears from Grizzlies, are shown at the right. Since all students in the school were surveyed, these ratios are the population ratios. The students in a math class had an assignment to collect random samples of 20 students in the school and compare the sample ratio to the population ratio. The results are shown below. Find each sample ratio for those who prefer “Bears,” and write it as a percent.

A. Sample 1: 13 students prefer “Bears”
Sample ratio of those who prefer “Bears”: 
Answer:
B. Sample 2: 16 students prefer “Bears”
Sample ratio of those who prefer “Bears”:
Answer:
C. Sample 3: 15 students prefer “Bears”
Sample ratio of those who prefer “Bears”:
Answer:
D. Do these sample ratios support the findings that 70% of the entire school population prefer the mascot name “Bears”? Explain.
Answer:
Turn and Talk Why are the sample ratios different from the population ratio?
Answer:
Question 2.
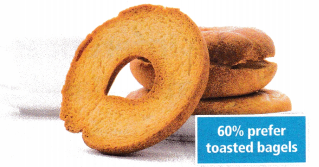
A bagel shop offering regular or toasted bagels makes the claim shown. Use each method to explore how much variation can be expected from a sample.
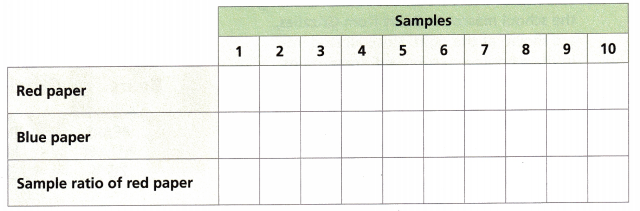
A. Construct a mock population. Place 60 red pieces of paper (for toasted) and 40 blue pieces of paper (for not toasted) in a bag.
Answer:
B. Randomly select 10 pieces of paper from the bag and record the results in the column for Sample 1. Be sure to return each piece of paper to the bag before you draw another piece.
Answer:
C. Repeat Step B nine more times, recording your results in the table.
Answer:
D. Plot the results in the dot plot.
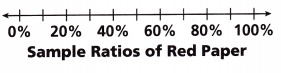
Answer:
E. How do the sample ratios compare with the population ratio?
Answer:
Turn and Talk How can repeated random samples of the same size from a population help you to understand the variation in the sample ratios?
Answer:
Check Understanding
Question 1.
A company manager takes a random sample of 20 employees and finds that 16 employees prefer day shifts to night shifts. Does this support the claim that 75% of employees prefer day shifts? Explain.
Answer:
Question 2.
With repeated samples, is the average of sample ratios more likely to approximate the population ratio than a single sample?
Answer:
On Your Own
Question 3.
Health and Fitness The results of a survey about whether students at a middle school prefer to participate in basketball or football are shown.

Bella used a random number generator to generate 10 samples of the population.
Numbers 1-65: basketball Numbers 66-100: football
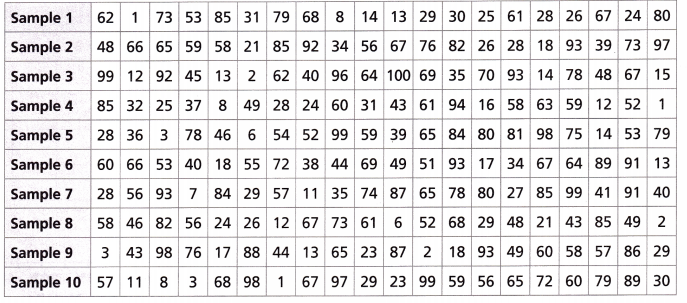
A. Use the random numbers from each sample to complete the table.
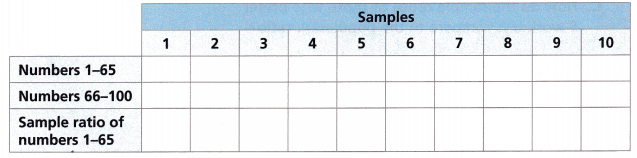
Answer:
B. Plot the results from the table in the dot plot.
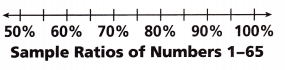
Answer:
C. How does the Sample 9 ratio compare to the population ratio.
Answer:
D. Construct Arguments How do the sample ratios compare to the population ratio?
Answer:
Question 4.
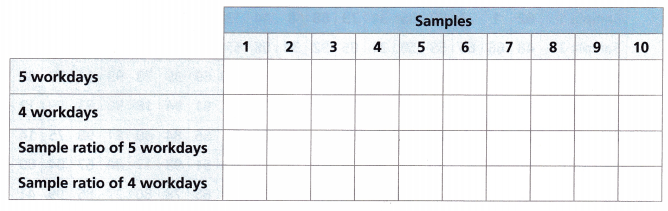
A factory owner surveyed employees about whether they prefer working 5 regular workdays or 4 longer workdays. The results are shown.
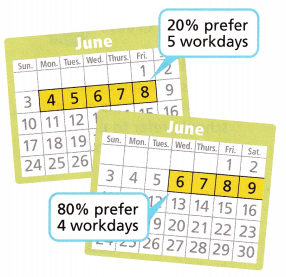
A. Construct a mock population using blue paper and green paper.
Blue: prefer 5 regular workdays Green: prefer 4 longer workdays.
Place 10 blue paper and 40 green paper in a hat. Randomly select a sample of 10 paper from the hat, and record the ratio. Replace the paper, and repeat for 10 samples.
Answer:
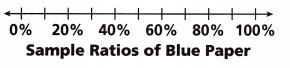
B. Plot the ratios of those who prefer 5 workdays in the dot plot.
Answer:
C. How do the sample ratios of those who prefer 5 workdays compare to the population ratio?
Answer:
D. Attend to Precision Plot the ratios of those who prefer 4 workdays in the dot plot.
Answer:
E. How do the sample ratios of green paper compare to the population ratio?
Answer:
Lesson 12.3 More Practice/Homework
A poll was conducted among all students at a middle school about whether they prefer blue or red. Use the resulting estimated population ratios shown for Problems 1 and 2.

Question 1.
Glen used a random number generator to generate the sample ratios shown in the chart.
Numbers 1-55: students who prefer blue Numbers 56-100: students who prefer red
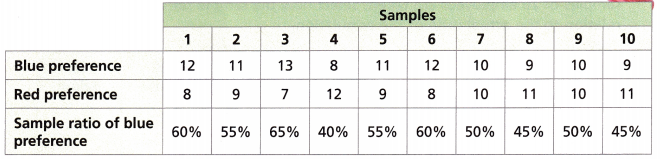
The sample ratio for blue preference in Sample 1 is (above / below) the population ratio.
The sample ratio for blue preference in Sample 8 is (above / below) the population ratio.
Answer:
Question 2.
A. Plot the results for blue preference from the table on the dot plot.
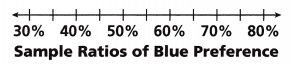
Answer:
B. Open-Ended How do the sample ratios Glen generated compare to the population ratio?
Answer:
C. Reason Predict what would happen to the sample ratios in the dot plot as more samples are taken.
Answer:
Test Prep
Question 3.
Abner researched and found that 60% of students in his school ride the bus to school. Abner took a random sample of 50 students and found that 38 ride the bus to school. Which statement correctly describes the sample ratio?
(A) The sample ratio is 38%, which is below the population ratio.
(B) The sample ratio is 38%, which is above the population ratio.
(C) The sample ratio is 76%, which is below the population ratio.
(D) The sample ratio is 76%, which is above the population ratio.
Answer:
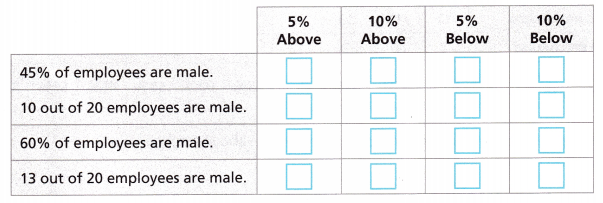
Question 4.
The population ratio of male employees in a large office is 55%. Random samples of 20 employees are taken. Select how the sample ratio varies in relation to the actual ratio of the population.
Answer:
Question 5.
Research claims that 30% of dental customers have had braces. Julie used a random number generator to generate samples, where numbers 1-3 represent having braces and numbers 4-10 represent not having braces. One sample is shown. How does the sample compare to the population?
Sample 5: 2 1 7 5 8 3 9 6 8 4 3 2 3 5 6 8 6 7 2 8
Answer:
Spiral Review
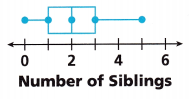
Question 6.
The results of a random survey about number of siblings of students are shown in the box plot. Make an inference about the larger student population.
Answer:
Question 7.
Libby bought 224 ounces of flour. If each bag contains 32 ounces of flour, how many bags of flour did Libby buy?
Answer:
Given,
Libby bought 224 ounces of flour.
Each bag contains 32 ounces of flour.
224/32 = 7
Thus Libby buys 7 bags of flour.