We included HMH Into Math Grade 7 Answer Key PDF Module 12 Lesson 2 Make Inferences from a Random Sample to make students experts in learning maths.
HMH Into Math Grade 7 Module 12 Lesson 2 Answer Key Make Inferences from a Random Sample
I Can use proportional reasoning to make inferences about populations based on the results of a random sample.
Spark Your Learning
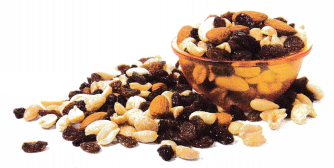
At a grocery store, a bin is filled with trail mix made by mixing raisins with a large 30-pound bag of nuts. Zane buys a small bag of a trail mix that contains 1\(\frac{1}{2}\) pounds of nuts and \(\frac{1}{2}\) pound of raisins. If the nuts and raisins in Zane’s bag are proportional to the nuts and raisins in the bin of trail mix, how many pounds of raisins do you think the store used to make the entire bin of trail mix?
Answer:
Turn and Talk How is the connection between the sample (small bag) and population (large bin) of trail mix similar to the sample and population of a survey?
Answer:
Build Understanding
Question 1.
To estimate the number of pets that students in your school have, conduct a survey of ten randomly selected students in your class.
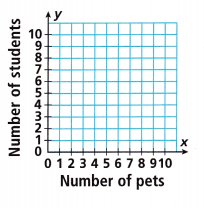
A. Plot the results of your survey on the grid provided.
Answer:
B. According to my survey, most students in my school have ____________ pets.
Answer:
C. According to my survey, about ___________ % of the students in my school have more than two pets.
Answer:
D. According to my survey, about % of the students in my school have zero pets.
Answer:
Conduct the same survey again using a second set of ten randomly selected students in your class.
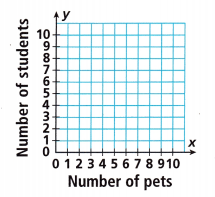
E. Plot the results of your survey on the grid provided.
Answer:
F. According to my survey, most students in my school have ___________ pets.
Answer:
G. According to my survey, about ___________ % of the students in my school have more than two pets.
Answer:
H. According to my survey, about __________ % of the students in my school have zero pets.
Answer:
I. Compare the results from both of your samples.
Are the results from the two samples exactly the same?
Answer:
Will a different sample give a different estimate?
Answer:
A sample ratio can be used to estimate a population ratio. However, because different samples will likely vary, a sample ratio must be considered as only an estimate of the population ratio.
Answer:
Turn and Talk Discuss how samples from random surveys can be improved to obtain better estimates about a population.
Answer:
Step It Out
To make inferences about a population based on a random representative sample, you can use proportional reasoning.
Question 2.
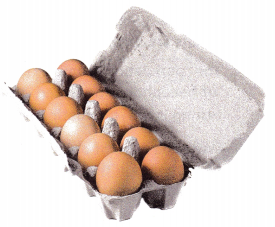
Javier randomly selects 12 cartons of eggs from the grocery store. He finds that 2 cartons have at least one broken egg.
Suppose there are 144 cartons of eggs at the grocery store. What is an estimate of the total number of those 144 cartons that have at least one broken egg?
A. Identify the sample.
Answer:
B. Identify the population.
Answer:
C. Write the ratio of cartons with at least one broken egg to the total number of cartons in the sample.
![]()
Answer:
D. Use the sample ratio to write an equation for the proportional relationship.
y = ![]() • 144
• 144
Answer:
E. Use your equation in Part D to estimate the number of cartons in the population that have at least one broken egg.

Answer:
Turn and Talk Discuss how to write an equation for the proportional relationship using a decimal or a percent for the sample ratio.
Answer:
Question 3.
A worker randomly selects one out of every 7 sets from the 3,500 sets of headphones produced. The results are shown.
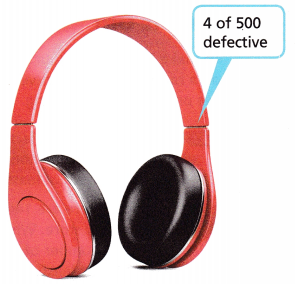
A. The (population / sample) is the total of 3,500 sets of headphones produced. The 500 selected for testing is the (population / sample).
Answer:
B. Write the ratio of defective headphones to total headphones in the sample. Then write the ratio as a decimal and as a percent.

Answer:
C. Write and solve an equation to find the number of headphones in the population that can be estimated to be defective.
y =  • 3,500
There would be about ![]() defective headphones.
defective headphones.
Answer:
Check Understanding
Question 1.
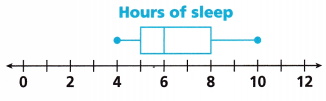
William conducted a random survey of the students in his school regarding the number of hours of sleep they got last night. The box plot shows the results of his survey. Make an inference about the entire population.
Answer:
Question 2.
Hazel assigned a number to each of the 100 students in the band and put the numbers in a bag. She randomly chose 20 numbers and found that 3 students did not complete their homework for today. Make an inference about the number of students in the band that did not do their homework. If Hazel randomly chose 20 more numbers, what results would you expect? Explain.
Answer:
On Your Own
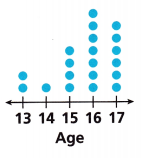
For Problems 3-5, make an inference about the ages of all drama club students at a theater conference using the dot plot showing the ages of students in a random sample of conference attendees.
Question 3.
Most drama club students at the conferenece are ___________ 15 years old.
Answer: From the above dot plot we can observe that Most drama club students at the conference are more than 15 years old.
Question 4.
About _________ % of the students at the conference plays are 16 years old or older.
Answer:
Total = 20
7 students at the conference plays are 16 years old or older.
7/20 = 0.35 = 35%
About 35% of the students at the conference plays are 16 years old or older.
Question 5.
Construct Arguments Would you think that it is likely for the number of 16-year-old students and the number of 17-year-old students to be almost equal in another random sample of conference attendees? Explain.
Answer:
Question 6.
A manager randomly selects 1,500 ink pens produced today and finds 12 of them defective. There were 12,000 ink pens produced today. Make an inference about the number of ink pens produced today that are defective.
The sample ratio of defective pens is or ![]() %.
%.
Inference: In the 12,000 population, the number of defective pens is
estimated to be ![]() • 12,000 =
• 12,000 = ![]() .
.
Answer:
Number of pens select randomly = 1500
Number of defective pens = 12
The sample ratio of defective pens is 12/1500 = 1/125 = 0.008 = 0.8%
Inference: In the 12,000 population, the number of defective pens is
estimated to be
1/125 × 12000 = 96
Question 7.
Gabby assigned a number to each of the 120 athletes at her school and put the numbers in a box. She randomly chose 25 numbers and found that 10 athletes were female. Use this sample to make an inference about how many athletes at Gabby’s school are female.
Answer:
Given,
Gabby assigned a number to each of the 120 athletes at her school and put the numbers in a box.
She randomly chose 25 numbers and found that 10 athletes were female.
10/25 = 0.4
0.4 × 100 = 40
10/25 = 40%
40% is the experimental probability for the number of female athletes in the sample.
40% of 120 should be about the number of female athletes in the whole school.
120 × 0.4 = 48
Question 8.
A random sample of dry-erase board markers at Juan’s school shows that 9 of the 60 dry-erase board markers do not work. There are 200 dry-erase board markers at Juan’s school. Make an inference about the number of dry-erase board markers at Juan’s school that do not work.
Answer:
Question 9.
A mail carrier randomly inspects every 20th letter being mailed. Out of 600 letters in the sample, 3 were open. There were 18,000 letters being mailed. Make an inference about the number of all the letters being mailed that were open.
Answer:
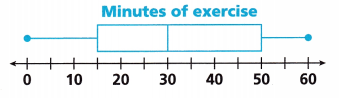
The box plot shows the results of a survey of the number of minutes that people at a variety of randomly selected gyms exercise. For Problems 10-13, make an inference about the number of minutes that people at gyms exercise according to this survey.
Question 10.
According to the survey, 75% of people at gyms exercise for ______________ minutes or longer.
Answer:
Question 11.
According to the survey, 25% of people at gyms exercise for more than ____________ minutes.
Answer:
Question 12.
According to the survey, __________ % of people at gyms exercise from 15 to 50 minutes.
Answer:
Question 13.
According to the survey, _____________ % of people at gyms exercise from 15 to 30 minutes.
Answer:
Question 14.
Health and Fitness Would the owners of another gym be able to use data from a survey like the one in Problems 10-13 to make inferences about the number of minutes people exercise at their gym? Explain your reasoning.
Answer:
Question 15.
A wildlife park manager is working on a request to expand the park. In a random selection during one week, 3 of every 5 cars have more than 3 people inside. If about 5,000 cars come to the park in a month, estimate how many cars that month would have more than 3 people inside. Show your work.
Answer:
I’m in a Learning Mindset!
How is making inferences from random samples similiar to the way I make decisions when I am learning something new?
Answer:
Lesson 12.2 More Practice/Homework
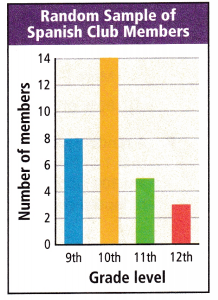
Xavier surveyed a random sample of the grade levels of the Spanish Club members in the county. The bar graph shows the results of his survey. Use this information for Problems 1-5.
Question 1.
The largest number of students in the Spanish Club are in ___________ grade.
Answer: The largest number of students in the Spanish Club are in 10th grade.
Question 2.
The same number of students in the Spanish Club are in the ______________ grade as are in the 11th and 12th grades combined.
Answer:
Students in 11th and 12th grades combined = 5 + 3 = 8
Number of students in 9th grade = 8
The same number of students in the Spanish Club is in the 9th grade as are in the 11th and 12th grades combined.
Question 3.
If there are 300 students in the Spanish Club in the county, predict how many are 10th graders.
Answer:
Total number of students = 8 + 14 + 5 + 3 = 30
Given condition, If there are 300 students in the Spanish Club in the county, predict how many are 10th graders.
Number of 10 grade students = 14
14 × 10 = 140
Thus if there are 300 students in the Spanish Club in the county then there are 140 students in 10th grade.
Question 4.
Of the 300 students, predict about how many are 9th graders.
Answer:
Number of students in 9th grade = 8
8 × 10 = 80
Of the 300 students, there are 80 students in the 9th grade.
Question 5.
Xavier conducted another random survey of the grade levels of the Spanish Club members in the county. In what grade would you expect to find the most students in Spanish Club? Explain.
Answer: You can expect most students in 10th grade.
Question 6.
A manager at a factory finds that in a random sample of 200 clocks, 15 are defective.
A. What percent of the clocks are defective?
Answer:
As it is given that a random sample of 200 clocks is taken out of 10,000 clocks, out of this 200, 15 clocks are defective.
Therefore, the number of clocks that are defective in 200 random samples is 15, which can be written as,
15/200 × 100 = 15/2 = 7.5%
B. Of the 10,000 clocks from which the sample was chosen, about how many clocks are probably not defective?
Answer:
As we got the ratio of the defective clocks, therefore, the number of defective clocks in 10,000 clocks can be written as,
7.5% of 10000
0.075 × 10,000 = 750
Therefore of the 10,000 clocks from which the sample was chosen, 750 clocks were defective.
C. The next day the manager finds only 8 of the 200 randomly selected clocks are defective. About how many clocks out of the 10,000 produced that day are probably defective?
Answer:
As in the next day, the manager finds only 8 of the 200 randomly selected clocks are defective.
Percentage of defective clock = 8/200 × 100 = 4%
As we got the ratio of the defective clocks, therefore, the number of defective clocks in 10,000 clocks can be written as,
4% of 10,000
0.04 × 10,000 = 400
Therefore, of 10,000 clocks from which the sample was chosen 400 clocks were defective.
Question 7.
Use Structure Based on a sample survey, a tutoring company claims that 90% of their students pass their classes. Out of 300 students, how many would you predict will pass?
Answer:
90% can be written as 0.90
Multiply the percentage with 300 we get
0.9 × 300 = 270 students
Test Prep
Question 8.
Ronnie surveyed a random selection of realtors in his town about the number of bedrooms in the houses for sale that week. The dot plot shows the results. Which inference is correct?
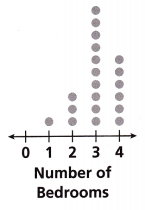
(A) Most of the houses have fewer than 3 bedrooms.
(B) Some houses have O bedrooms.
(C) More than 50% of the houses have exactly 3 bedrooms.
(D) 80% of the houses have 3 or 4 bedrooms.
Answer: (C) More than 50% of the houses have exactly 3 bedrooms.
Question 9.
A random sample of laptop computers at an electronics store shows that 1 of the 25 sampled laptop computers has a malfunction. There are 300 laptop computers at the electronics store. Estimate the number of laptop computers at the electronics store that have malfunctions.
Answer:
Given,
A random sample of laptop computers at an electronics store shows that 1 of the 25 sampled laptop computers has a malfunction.
There are 300 laptop computers at the electronics store.
300 ÷ 25 = 12
Thus 12 laptop computers at the electronics store have malfunctioned.
Question 10.
Jaylen used the seat number for each of the 6,500 fans’ seats in the stands at a college football game and put the numbers in a computer program. He randomly chose 200 numbers and found that 36 of those people had also purchased a parking voucher. Estimate the number of fans ¡n the stands at a sold-out football game that purchased a parking voucher. Explain.
Answer:
Number of seats = 6500
Sample = 200
Voucher = 36
proportion = voucher/sample
p = 36/200
p = 0.18
Using the larger population 6500 the estimate of people that have bought the voucher is calculated
Estimate = proportion × seats
Estimate = 0.18 × 6500
Estimate = 1170 seats
Spiral Review
Question 11.
Ricardo jogged up 864 steps in 13\(\frac{1}{2}\) minutes. What is Ricardo’s average number of steps per minute?
Answer:
Given,
Ricardo jogged up 864 steps in 13\(\frac{1}{2}\) minutes.
13\(\frac{1}{2}\) = 13.5
864/13.5 = 64
Therefore Richard jogged 64 steps per minute.
Question 12.
Imani wants to know the favorite day of the week of adults in the town where she lives. Imani surveys every tenth adult that enters a convenience store between 4:00 p.m. and 8:00 p.m. Identify the population and sample.
Answer:
Given,
Imani wants to know the favorite day of the week of adults in the town where she lives.
Imani surveys every tenth adult that enters a convenience store between 4:00 p.m. and 8:00 p.m.
The population is adults in the town
The sample is every 10th adult