We included HMH Into Math Grade 6 Answer Key PDF Module 15 Lesson 3 Choose a Measure of Center to make students experts in learning maths.
HMH Into Math Grade 6 Module 15 Lesson 3 Answer Key Choose a Measure of Center
I Can find the mean, median, and mode for a given data set and determine the best measure of center to describe the data set.

Step It Out
Question 1.
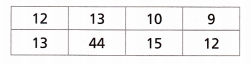
The table shows the numbers of songs downloaded in one week by some students.
A. What do you notice about the data in the table?
The data value of _________ is much _________ than the other data values in the table.
Answer:
Outlier is the numbers that are either really small than the rest of the data or extremely large than the rest of the data
44 is the outlier.
The data value of the outlier is much greater than the other data values in the table.
Connect to Vocabulary
An outlier is a value much greater or much less than the other values in a dataset. A set of data can have more than 1 outlier.
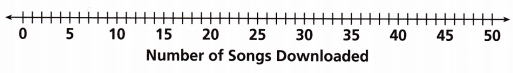
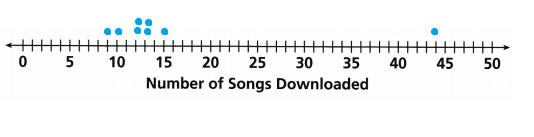
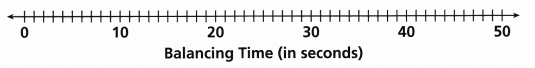
B. Complete the dot plot to represent the data.
Answer:
Given that, The data is 12, 13, 10, 9 13, 44, 15, 12.
Plot the data on the number line.
C. Which value in the data set is an outlier? Explain how you know.
Answer:
Outlier is the numbers that are either really small than the rest of the data or extremely large than the rest of the data
In the data 44 is larger than the rest of the data.
So, 44 is the outlier.
D. Find the mean, median, and mode with and without the outlier. Then complete the sentences.
The mean with the outlier is __________, and the mean without the outlier is __________. The outlier makes the mean __________.
The median with the outlier is __________, and the median without the outlier is __________. The outlier makes the median __________.
The mode with the outlier is __________, and the mode without the outlier is __________. The outlier __________ the mode.
Answer:
Given that,
The data is 12, 13, 10, 9, 13, 44, 15, 12.
Outlier is the numbers that are either really small than the rest of the data or extremely large than the rest of the data
In the data 44 is larger than the rest of the data.
So, 44 is the outlier.
Mean with outlier = sum of the given data/ total numbers of data.
= 12 + 13 + 10 + 9 + 13 + 44 + 15 + 12/8
Mean with outlier = 128/8 = 16
Mean without outlier = 84/7 = 12.
To find the median first write the given data in the ascending order.
9, 10, 12, 12, 13, 13, 15, 44
Median is defined as the mean of the two middle values for an even number of data.
For an odd number of data, the median is the middle number of the data.
Median with outlier = 12 + 13 /2 = 12.5
Median without outlier = 12
Mode is the number that appears most in the data.
Mode with outlier = 12, 13
Mode without outlier = 12, 13.
The mean with the outlier is 16, and the mean without the outlier is 12. The outlier makes the mean effect.
The median with the outlier is 12.5, and the median without the outlier is 12, The outlier makes the median effect.
The mode with the outlier is 12, 13, and the Mode without the outlier is 12, 13, The outlier does not affect the Mode.
Turn and Talk When the outlier is included, which measure of center is least representative of the data set? Why?
Answer:
Question 2.
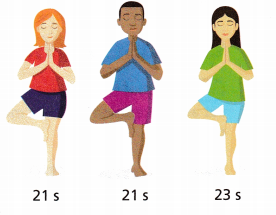
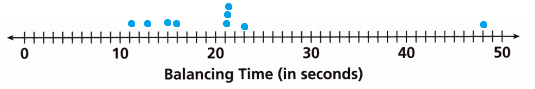
A group of friends decide to see who can balance themselves the longest on one foot with their eyes closed. The results, in seconds, are listed.
21, 21, 23, 11, 48, 21, 16, 15, 13
A. Complete the dot plot of the data.
Answer:
Given that,
The seconds are 21, 21, 23, 11, 48, 21, 16, 15, 13
Plot the points on the dot plot.
B. Use the dot plot to complete the sentences.
The data value of __________ is an outlier.
The mean with the outlier is _________, and the mean without the outlier is about __________. The outlier made the mean __________.
The median with the outlier is __________, and the median without the outlier is __________. The outlier made the median __________.
The mode with the outlier is __________. and the mode without the outlier is __________. The outlier _______________ the mode.
Answer:
Given that,
The seconds are 21, 21, 23, 11, 48, 21, 16, 15, 13
Outlier is the numbers that are either really small than the rest of the data or extremely large than the rest of the data
In the data 48 is larger than the rest of the data.
So, 48 is the outlier.
Mean with outlier = sum of the second/ number of the seconds.
21 + 21 + 23 + 11 + 48 + 21 + 16 + 15 + 13 /9
= 189/9
Mean with outlier = 21.
Mean without outlier = 21 + 21 + 23 + 11 + 21 + 16 + 15 + 13 /8
= 141/8
Mean without outlier = 17.6
To find the median write the seconds in the ascending order.
11, 13, 15, 16, 21, 21, 21, 23, 48.
Median is defined as the mean of the two middle values for an even number of data.
For an odd number of data, the median is the middle number of the data.
Median with outlier = 21
Median without outlier = 16 + 21/2 = 18.5
Mode is the number that appears most in the data.
Mode with outlier = 21
Mode without outlier = 21
The data value of 48 is an outlier.
The mean with the outlier is 21, and the mean without the outlier is about 17.6. The outlier made the mean effect.
The median with the outlier is 21, and the median without the outlier is 18.5. The outlier made the median effect.
The mode with the outlier is 21. and the mode without the outlier is 21. The outlier does not affect the Mode.
C. The best measure of center for this data set is the median or the __________, because the __________ with the outlier is too high.
Answer:
The best measure of center for this data set is the median or the mean because the data set with the outlier is too high.
Check Understanding
Question 1.
Xavier drew 10 cards at random from a deck of numbered cards. The deck is composed of 3 sets of cards numbered 1 through 10 and three cards numbered 50. He recorded the numbers he drew: 8, 7, 9, 1, 10, 10, 50, 2, 5, 3. Find the mean, median, and mode of the data. What would happen to the mean, median, and mode if Xavier drew a 4 card instead of the 50 card?
Answer:
Given that,
The data is 8, 7, 9, 1, 10, 10, 50, 2, 5, 3.
Mean = sum of the data / total number of data.
= 8 + 7 + 9 + 1 + 10 + 10 + 50 + 2 + 5 + 3 /10
= 105/10
Mean = 10.5
To find the median write the seconds in the ascending order.
1, 2, 3, 5, 7, 8, 9, 10, 10, 50
Median is defined as the mean of the two middle values for an even number of data.
For an odd number of data the median is the middle number of the data.
Median = 7 + 8/2 = 7.5
Mode is the number that appears most in the data.
Mode = 10.
The data is 8, 7, 9, 1, 10, 10, 50, 2, 5, 3.
Mean = sum of the data / total number of data.
= 8 + 7 + 9 + 1 + 10 + 10 + 50 + 2 + 5 + 3 /10
= 105/10
Mean = 10.5
To find the median write the seconds in the ascending order.
1, 2, 3, 5, 7, 8, 9, 10, 10, 50
Median is defined as the mean of the two middle values for an even number of data.
For an odd number of data, the median is the middle number of the data.
Median = 7 + 8/2 = 7.5
Mode is the number that appears most in the data.
Mode = 10.
Drew a 4 card instead of the 50 card is
The data is 8, 7, 9, 1, 10, 10, 4, 2, 5, 3.
Mean = sum of the data / total number of data.
= 8 + 7 + 9 + 1 + 10 + 10 + 4 + 2 + 5 + 3 /10
= 59/10
Mean = 5.9
To find the median write the seconds in the ascending order.
1, 2, 3, 4, 5, 7, 8, 9, 10, 10.
Median is defined as the mean of the two middle values for an even number of data.
For an odd number of data, the median is the middle number of the data.
Median = 5 + 7/2 = 6
Mode is the number that appears most in the data.
Mode = 10.
Drew a 4 card instead of the 50 cards Then the mean and median of the data will change. But the mode has not changed.
Question 2.
Find the mean, median, and mode of the data: 0, 100, 25, 25, 25. Which outlier, 0 or 100, affects the data more? Why?
Answer:
Given that,
The data is 0, 100, 25, 25, 25
Mean = sum of the data/ Total number of data
Mean = 0 + 100 + 25 + 25 + 25/5
= 175/5
Mean = 35.
To find the median write the seconds in the ascending order.
0, 25, 25, 25, 100
Median is defined as the mean of the two middle values for an even number of data.
For an odd number of data, the median is the middle number of the data.
Median = 25
Mode is the number that appears most in the data.
Mode = 25.
The outlier without 0
The data is 100, 25, 25, 25
Mean = sum of the data/ Total number of data
Mean without outlier 0 = 100 + 25 + 25 + 25/5
= 175/4
Mean without outlier 0 = 43.75
To find the median write the seconds in the ascending order.
25, 25, 25, 100
Median is defined as the mean of the two middle values for an even number of data.
For an odd number of data, the median is the middle number of the data.
Median = 25 + 25/2
Median without outlier 0 = 25
Mode is the number that appears most in the data.
Mode without outlier 0 = 25.
The outlier without 100
The data is 0, 25, 25, 25
Mean = sum of the data/ Total number of data
Mean = 0 + 25 + 25 + 25/4
= 75/4
Mean without outlier 100 = 18.75
To find the median write the seconds in the ascending order.
0, 25, 25, 25
Median is defined as the mean of the two middle values for an even number of data.
For an odd number of data, the median is the middle number of the data.
Median without outlier 100 = 25 + 25/2 = 25
Mode is the number that appears most in the data.
Mode without outlier 100 = 25.
The outlier 100 affects the data more. It does not affect the median and mode it only affected the mean.
On Your Own
Question 3.
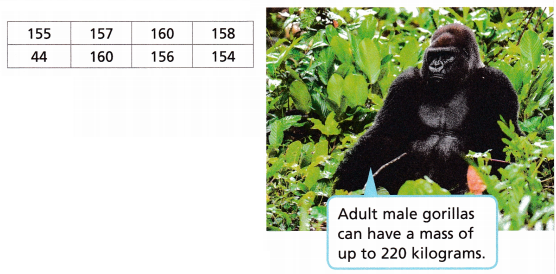
The table shows the masses (in kilograms) of eight gorillas.
A. What are the mean, median, and mode of the data?
Answer:
Given that,
Mass of 8 gorillas is 155, 157, 160, 158, 44, 160, 156, 154.
Mean = sum of the Masses/ number of masses.
= 155 + 157 + 160 + 158 + 44 + 160 + 156 + 154/8
= 1144/8
Mean = 143
To find the median first write the data in the ascending order.
44, 154, 155, 156, 157, 158, 160,160.
Median is defined as the mean of the two middle values for an even number of data.
For an odd number of data, the median is the middle number of the data.
Median = 156 + 157/2 = 156.5
Mode is a number that appears more in the data.
Mode = 160.
B. Which mass is the outlier of the data?
Answer:
Outlier is the numbers that are either really small than the rest of the data or extremely large than the rest of the data
In the data 44 is smaller than the rest of the data.
So, 44 is the outlier.
C. How does the outlier affect the mean, median, and mode?
Answer:
The outlier affects the mean median and mode
In the mean, the outlier changes the mean of the data and in the median, the outlier affects little by changing the median.
The outlier does not affect the Mode.
D. Which measure of center best represents the data? Why?
Answer:
The median represents the best measure of center. Because the median is the middle value of the data.
To find the median first write the data in the ascending order.
44, 154, 155, 156, 157, 158, 160,160.
Median is defined as the mean of the two middle values for an even number of data.
For an odd number of data, the median is the middle number of the data.
Median = 156 + 157/2 = 156.5
Question 4.
Attend to Precision The circumference of a pumpkin is the distance around it. The following are circumferences (in inches) of some pumpkins growing in a pumpkin patch: 16, 12, 14, 17, 15, 9, 8, 5.
A. Make a dot plot of the data.
Answer:
Given that,
The circumferences are 16, 12, 14, 17, 15, 9, 8, and 5.
Plot the circumferences on the dot plot.
![]()
B. What is the mean of the data?
Answer:
Given that,
The circumferences are 16, 12, 14, 17, 15, 9, 8, and 5.
Mean = sum of the circumference / number of circumferences.
= 16 + 12 + 14 + 17 + 15 + 9 + 8 + 5 /8.
=96/8
Mean = 12.
C. What is the median of the data?
Answer:
To find the median first write the data in the ascending order.
5, 8, 9, 12, 14, 15, 16, 17
Median is defined as the mean of the two middle values for an even number of data.
For an odd number of data, the median is the middle number of the data.
Median = 12 + 14/2
=26/2
Median = 13
D. What is the mode of the data?
Answer:
A mode is a number that appears more in the data.
In the given data every number appears only one time.
So, the given data has no mode.
E. Which measure of center best represent this data? Explain.
Answer:
The median represents the best measure of center. Because the median is the middle value of the data.
The median of the given data is 13.
Question 5.
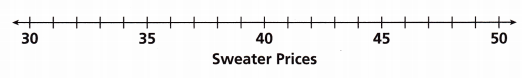
Simone’s grandmother likes to give sweaters as gifts. She has eight grandchildren. The prices of the first seven sweaters she buys are shown.
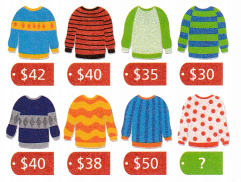
A. How much does the 8th sweater cost if the mean price of all the sweaters is $40? __________
Answer:
Given that,
Let us consider the unknown cost of the sweater as x.
The prices of the sweaters is $42, $40, $35, $30, $40,$38, $50, x
The mean price of all the sweaters is $40
= $42 + $40 + $35 + $30 + $40 + $38 + $50 + x/8
40 = 275 + x/8
40 x 8 = 275 + x
320 – 275 = x
45 = x
The cost of unknow sweater = $45.
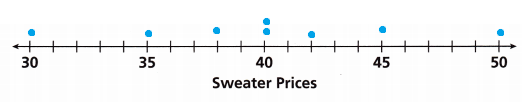
B. Complete the dot plot to represent the prices of the sweaters.
Answer:
Given that the data is $42, $40, $35, $30, $40,$38, $50, $45.
Plot the data on the data line.
C. What are the mean, median, and mode of all sweaters?
Answer:
Mean = sum of the data/ total numbers in the data.
= $42 + $40 + $35 + $30 + $40 + $38 + $50 + $45/8
= 320/8
Mean = 40.
To find the median first write the data in the ascending order.
$30, $35, $38, $40, $40 $42, $45, $50.
Median is defined as the mean of the two middle values for an even number of data.
For an odd number of data, the median is the middle number of the data.
Median = 40 + 40/2
=80/2
Median = 40
Mode is the number that appears most in the data.
Mode = 40.
D. Which measure of center best represents the data? Explain.
Answer:
The median represents the best measure of center. Because the median is the middle value of the data.
The median of the given data is 40.
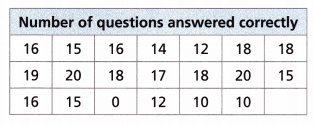
Question 6.
The numbers of questions out of 20 that the students in a class got correct on a quiz are shown in the table.
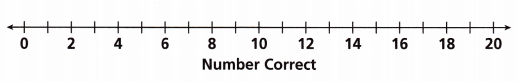
A. Complete the dot plot of the data.
Answer:
Given that
The data is 16, 15, 16, 14, 12, 18, 18, 19, 20, 18, 17, 18, 20, 15, 16, 15, 0, 12, 10, 10.
Plot the data on the data line.
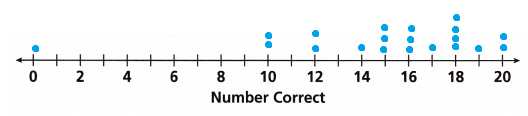
B. How does the outlier affect the data? Explain.
Answer:
The outlier affects the data by changing the mean and median values.
C. Which measure of center best represents the data? Why?
Answer:
The median represents the best measure of center. Because the median is the middle value of the data.
Question 7.
Open-Ended Describe a data set that has the same mean, median, and mode.
Answer:
The data with five 1 has the same mean median and mode.
The data is 1, 1, 1, 1, 1.
Mean = sum of the data/ total numbers in the data.
Mean = 1 + 1 + 1 + 1 + 1/5
= 5/5 = 1.
Median is defined as the mean of the two middle values for an even number of data.
For an odd number of data, the median is the middle number of the data.
Median = 1
Mode is the number that appears more in the data.
Mode = 1
Lesson 15.3 More Practice/Homework
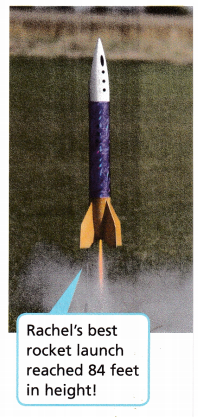
Question 1.
STEM Rachel launched several model rockets and calculated the height, in feet, of each launch. The heights were: 75, 70, 80, 72, 84, 37, 65, 67, and 80.
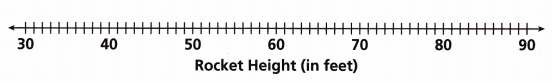
A. Complete the dot plot to represent the data.
Answer:
Given that,
The heights are 75, 70, 80, 72, 84, 37, 65, 67, 80.
Plot the heights in the data line.
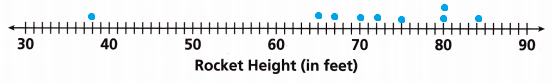
B. Find the mean, median, and mode of the heights.
Mean: ___________
Median: ___________
Mode: _____________
Answer:
Given that,
The heights are 75, 70, 80, 72, 84, 37, 65, 67, 80.
Mean = sum of the heights/ number of the heights
= 75 + 70 + 80 + 72 + 84 + 37 + 65 + 67 + 80 /9
= 630/9
Mean = 70.
To find the median first write the data in the ascending order.
37, 65, 67, 70, 72, 75, 80, 80, 84
Median is defined as the mean of the two middle values for an even number of data.
For an odd number of data, the median is the middle number of the data.
Median = 72.
Mode is the number that appears more in the data.
The number 80 is the most appearing number.
So, 80 is the median.
C. How are the data affected by the outlier?
Answer:
Outlier will affect the mean and median values.
Given that the heights are 75, 70, 80, 72, 84, 37, 65, 67, 80.
The outlier is 37.
Mean with outlier = sum of the heights/ number of the heights
= 75 + 70 + 80 + 72 + 84 + 37 + 65 + 67 + 80 /9
= 630/9
Mean with outlier= 70.
Mean without outlier = 75 + 70 + 80 + 72 + 84 + 65 + 67 + 80 /8.
= 593/8
Mean without outlier = 74.12
To find the median first write the data in the ascending order.
37, 65, 67, 70, 72, 75, 80, 80, 84
Median is defined as the mean of the two middle values for an even number of data.
For an odd number of data, the median is the middle number of the data.
Median with outlier = 72.
Median without outlier = 72 + 75 /2 = 73.5
D. Which measure of center best represents the data? Why?
Answer:
The median represents the best measure of center. Because the median is the middle value of the data.
The median of the given data is 72.
Question 2.
Reason Hayden recorded the following measurements, in centimeters. He noted he was missing one measurement. If the mean is 1 centimeter, what is the value of the missing measurement? Explain.
0.1, 0.2, 0.1, 0.2, 0.3, 0.1, 0.2.
Answer:
Given that,
The mean = 1 cm
The given data is 0.1, 0.2, 0.1, 0.2, 0.3, 0.1, 0.2.
The value of the missing measurement is x
Mean = 0.1 + 0.2 + 0.1 + 0.2 + 0.3 + 0.1 + 0.2 + x / 8
1 = 1.2 + x /8
1.2 + x = 8
x = 8 – 1.2
x = 6.8
= 0.1 + 0.2 + 0.1 + 0.2 + 0.3 + 0.1 + 0.2 + 6.8 / 8.
= 8/8 = 1.
The missing measurement is 6.8 cm.
Question 3.
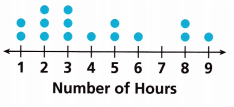
Math on the Spot The dot plot shows the numbers of hours 15 people spent on the telephone in one week. Which measure of center best describes these data? Justify your answers.
Answer:
Given that,
The data is 1, 1, 2, 2, 2, 3, 3, 3, 4, 5, 5, 6, 8, 8, 9.
The median represents the best measure of center. Because the median is the middle value of the data.
Median = 3
Test Prep
Question 4.
Identify any outliers in the data. Select all that apply. 3, 8, 4, 7, 62, 10, 9, 59, 12
(A) 3
(B) 8
(C) 10
(D) 59
(E) 62
Answer:
Outlier is the numbers that are either really small than the rest of the data or extremely large than the rest of the data
The data 62 is larger than the rest of the data.
So, 62 is the outlier.
Option E is the correct answer.
Question 5.
The monthly rents for 8 apartments are shown.
$650, $600, $800, $700, $600, $600, $750, $2,000
Which measure of center best represents the data?
Answer:
The median represents the best measure of center. Because the median is the middle value of the data.
Median of the given data = $700 + $600/2
= $1300/2
Median = $650
Question 6.
What is the mode of the data?
0, 5, 8, 12, 14, 19, 11, 3
(A) 0
(B) 3
(C) 5
(D) No mode
Answer:
The given data has no mode. Because no number in the data set appears more than one time.
Option D is the correct answer.
Question 7.
A basketball team has scored the following numbers of points in games this season.
65, 60, 58, 52, 50, and 51
Find the mean, median, and mode of the data.
Answer:
Given that,
The data is 65, 60, 58, 52, 50, 51.
The formula for the Mean = sum of observations/ total number of observations
= 65 + 60 + 58 + 52 + 50 + 51/6
= 56
Mean = 56.
To find the median first write the given data in the ascending order.
50, 51, 52, 58, 60,65.
median is defined as the mean of the two middle values
= 52 + 58/2 = 55
55 is the median.
If no number in the data set appears more than one time then the set has no mode.
Mode is not available for the given data.
Spiral Review
Question 8.
Find the surface area of a rectangular prism with a length of 6.1 centimeters, a width of 5.2 centimeters, and a height of 4 centimeters.
Answer:
The formula for the surface area of the rectangular prism = 2(lw + wh + lh)
length = 6.1 cm
width = 5.2 cm
height = 4 cm
= 2(6.1 x 5.2 + 5.2 x 4 + 6.1 x 4)
= 2(31.72 + 20.8 + 24.4)
= 97.0344 sq. cm.
The surface area of the rectangular prism = 97.0344 sq. cm.
Question 9.
Write an equation to represent the data in the table.
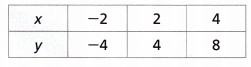
Answer:
The equation is y = mx + b
m = y2 – y1/ x2 – x1
= 4 -(-4)/2 – (-2)
= 8/4
m = 2
And
8-4/4-2
4/2
= 2
There slope = 2
Y = 2x + b
Here x = -2 and y = -4.
-4 = 2(-2) + b
-4 = -4 + b
b = 1
Y = 2x + 1
Therefore the equation y = 2x + 1 represents the data in the table.