We included HMH Into Math Grade 6 Answer Key PDF Module 15 Lesson 2 Find Measures of Center to make students experts in learning maths.
HMH Into Math Grade 6 Module 15 Lesson 2 Answer Key Find Measures of Center
I Can find and interpret the mean, median, and mode of a set of data.
Spark Your Learning
The list shows the heights, in inches, of the players on a high school basketball team. How can you describe the typical height of this data with a single value?
69, 73, 68, 72, 75, 72, 78, 74, 74, 80, 69, 70, 72

Answer:
Given data,
69, 73, 68, 72, 75, 72, 78, 74, 74, 80, 69, 70, 72
Mean = sum of observations/number of observations
Mean = (63+73+68+72+75+72+78+74+74+80+69+70+72)/13
Mean = 72.76
Median:
First, arrange the given data in ascending order.
68,69,69,70,72,72,72,73,74,74,75,78,80
Median is the middle number or average of the two middle numbers in an ordered set of data.
72 is the median of the given data.
Mode:
Mode is the number or numbers that occur most frequently in a set of data.
72 is repeated many times.
So, 72 is the mode of the data.
Turn and Talk How would the center change if the tallest player left the team and was replaced by a player who is 66 inches tall? Explain.
Answer: The height of the tallest player on the team is 80.
Replace 80 with 66.
66,68,69,69,70,72,72,72,73,74,74,75,78
The Median is 72. That means there is no change in the median.
Build Understanding
A measure of center is used to describe the middle of a data set.
Connect to Vocabulary
Mean is the sum of the items in a set of data divided by the number of items in the set also called average.
Median is the middle number or means (average) of the two middle numbers in an ordered set of data.
Mode is the number or numbers that occur most frequently in a set of data; when all numbers occur with the same frequency, we say there is no mode.
Question 1.
Look at the stacks of counters. The heights of the stacks from left to right are 8, 3, 7, 5, and 7.
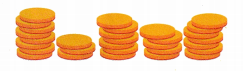
A. Arrange the stacks in a row from shortest to greatest. What is the height of the middle stack?
Answer:
Given,
8, 3, 7, 5, and 7
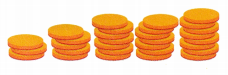
Arrange the stacks in a row from shortest to greatest.
3, 5, 7, 7, 8.
The height of the middle stack is 7.
B. What is the measure of center represented by the middle stack?
Answer: Median is the measure of center represented by the middle stack
C. Look at the stacks of counters in Part A. What is the most common height for the stacks? Explain why it is the most common.
Answer: 7 is the common height for the stacks.
Explanation:
Given data is 8, 3, 7, 5, and 7.
7 is the highest repeated height.
So, the mode of the given data is 7.
D. What is the measure of center represented by the most common stack height?
Answer: Mode is the measure of center represented by the most common stack height
E. Rearrange the counters so that all of the stacks have the same number of counters. Now how many counters are in each stack? Show your work.
Answer:
Given data is 8, 3, 7, 5, and 7.
Mean = sum of observations/number of observations
Mean = (8 + 3 + 7 + 5 + 7)/5 = 30/5 = 6
Thus there are 6 counts in each stack.
F. What measure of center is represented when all the stacks have the same number of counters?
Answer: Mean is the measure of center is represented when all the stacks have the same number of counters.
Turn and Talk How do you know which measure of center best represents a set of data? Give an example.
Answer:
The mean and the median can be calculated to help you find the “center” of a data set. The mean is the best estimate for the actual data set, but the median is the best measurement when a data set contains several outliers or extreme values.
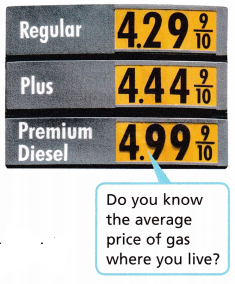
Question 2.
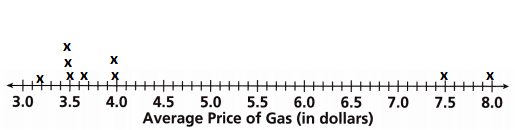
The data show the average price of gas (in dollars and cents) at some gas stations around the world. Find the mean, median, and mode of the data.
![]()
A. Complete the dot plot to represent the data.
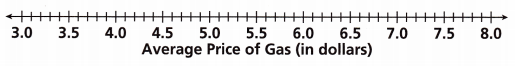
Answer:
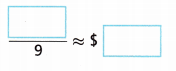
B. Complete the equations to find the mean.
3.50 + 3.65 + 3.50 + 3.25 + 7.50 + 4.00 + 7.99 + 3.50 + 4.00 = __________
Answer:
3.50 + 3.65 + 3.50 + 3.25 + 7.50 + 4.00 + 7.99 + 3.50 + 4.00 = 40.89
Mean = 40.89/9 ≈ 4.5
C. Write the data in order from least to greatest and circle the median.
Answer:
Given data,
3.50, 3.65, 3.50, 3.25, 7.50, 4.00, 7.99, 3.50, 4.00
First, arrange the given data in ascending order.
3.25, 3.50, 3.50, 3.50, 3.65, 4, 4, 7.50, 7.99
3.65 is the median of the data.
D. What is the mode of the data?
Answer:
Given data,
3.50, 3.65, 3.50, 3.25, 7.50, 4.00, 7.99, 3.50, 4.00
3.50 – 3
4 – 2
3.50 is the mode of the data.
Turn and Talk Suppose the average gas prices had been given in a histogram instead of a table. Could you have found the mean, median, or mode?
Answer:
Check Understanding
Question 1.
Zayn surveyed a group of people about how many times they ate at a restaurant last month. The results are: 4, 0, 21, 14, 12, 30, 8, 7, 8, 7, 7, 10, 14, 12. Find the mean, median, and mode of the data.
Mean: ___________
Median: ___________
Mode: ___________
Answer:
Mean: 11
Median: 9
Mode: 7
Explanation:
Mean:
Given data,
The results are: 4, 0, 21, 14, 12, 30, 8, 7, 8, 7, 7, 10, 14, 12.
Mean = sum of observations/number of observations
Mean = (4+0+21+14+12+30+8+7+8+7+7+10+14+12)/14
Mean = 11
Median:
First, arrange the given data in ascending order.
0, 4, 7, 7, 7, 8, 8, 10, 12, 12, 14, 14, 21, 30
Median = (8+10)/2
Median = 9
Mode = 7, 8, 12, 14
7 repeated 3 times.
So, the mode of this data is 7.
Question 2.
Find the mean, median, and mode of the data:
2.4, 1.9, 3.3, 3.5, 3.2, 2.7, 1.1, 20.9, 2.4.
Mean: ___________
Median: ___________
Mode: ___________
Answer:
Mean: 4.6
Median: ___________
Mode:
Explanation:
Given data,
2.4, 1.9, 3.3, 3.5, 3.2, 2.7, 1.1, 20.9, 2.4
Mean = sum of observations/number of observations
Mean = (2.4+1.9+3.3+3.5+3.2+2.7+1.1+20.9+2.4)/9
Mean = 4.6
Median:
First, arrange the given data in ascending order.
1.1, 1.9, 2.4, 2.4, 2.7, 3.2, 3.3, 3.5, 20.9
Median = 2.7
2.4 is repeated two times.
So, the mode of the given data is 2.4
On Your Own
Question 3.
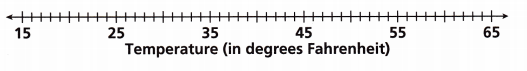
Eric recorded the temperature (in °F) for 10 days and displayed the information in a table.
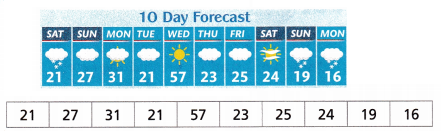
A. Complete the dot plot to represent the data.
Answer:
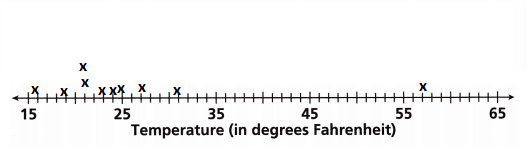
B. What is the mean of the data?
Answer:
Given data,
21, 27, 31, 21, 57, 23, 25, 24, 19, 16
Mean = sum of observations/number of observations
Mean = (21+27+31+21+57+23+25+24+19+16)/10
Mean = 264/10 = 26.4
Thus the mean of the data is 26.4
C. What is the median of the data?
Answer:
Given data,
21, 27, 31, 21, 57, 23, 25, 24, 19, 16
First, arrange the given data in ascending order.
16, 19, 21, 21, 23, 24, 25, 27, 31, 57
Median = (23+24)/2
Median = 23.5
Thus the median of the data is 23.5
D. What is the mode of the data?
Answer:
Given data,
21, 27, 31, 21, 57, 23, 25, 24, 19, 16
21 – 2
The mode of the data is 2.
Question 4.
Attend to Precision The 40-yard dash times, in seconds, for 7 runners are shown.
4.8, 5.3, 5.2, 6.4, 5.4, 5.3, 5.4
A. What is the mean of the data?
Answer:
Given data,
4.8, 5.3, 5.2, 6.4, 5.4, 5.3, 5.4
Mean = sum of observations/number of observations
Mean = (4.8+5.3+5.2+6.4+5.4+5.3+5.4)/7
Mean = 37.8/7
Mean = 5.4
B. What is the median of the data?
Answer:
Given data,
4.8, 5.3, 5.2, 6.4, 5.4, 5.3, 5.4
First, arrange the given data in ascending order.
4.8, 5.2, 5.3, 5.3, 5.4, 5.4, 6.4
5.3 is the median of the data.
C. What is the mode of the data?
Answer:
Given data,
4.8, 5.3, 5.2, 6.4, 5.4, 5.3, 5.4
5.3 – 2
5.4 – 2
5.3 and 5.4 is the mode of the data.
D. Which of the measures of center has more than one possible value?
Answer: Mode has more than one possible value.
Question 5.
Reason Look at the data. 0, 1, 2, 1, 2, 0, 1, 2, 0, 2, 1, 2, 1, 2. Which measure of center could best be used to describe the data? Explain.
Answer:
Given data,
0, 1, 2, 1, 2, 0, 1, 2, 0, 2, 1, 2, 1, 2
The mode could be used to describe the data.
0 – 3
1 – 5
2 – 6
2 is the mode of the given data.
Question 6.
Open-Ended Describe a set of data that has no mode, 1 mode, and more than one mode.
Answer:
Data 17, 25, 23, 200, 14
There are no similar values in the data so there is no mode.
Data 17, 25, 23, 200, 14, 14
There is 1 similar value in the data so the mode is 14.
I’m in a Learning Mindset!
What differences between the three measures of center can I talk about?
Answer: The three measures of center are mean, median, and mode.
Mean: The mean or average is calculated from the sum of all observations divided by the number of observations.
Median: Median is the middle number or average of the two middle numbers in an ordered set of data. If the number of observations is odd then we can directly take the middle number as the median. If the number of observations is even then we have to find the average of the two middle values.
Mode: Mode is the number or numbers that occur repeatedly in a set of data; when all numbers occur with the same frequency, we say there is no mode.
Lesson 15.2 More Practice/Homework
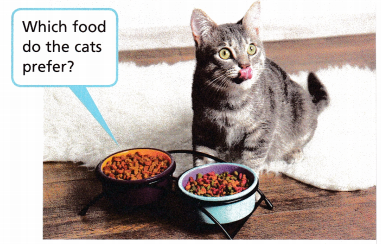
Question 1.
Summer wants to know which cat food her cats prefer. She fed the cats and recorded the number of grams of food the cats ate each day. The results are: 60 grams, 63 grams, 61 grams, 58 grams, 65 grams, 60 grams, and 60 grams.
A. How many days did Summer log the amount of food her cats ate?
Answer: 7 days
B. On average, how many grams of food did her cats eat each day?
Answer:
Given data,
60 grams, 63 grams, 61 grams, 58 grams, 65 grams, 60 grams, and 60 grams.
Mean = sum of observations/number of observations
Mean = 60+63+61+58+65+60+60/7 = 427/7 = 61
C. Which amount represents the mode of the data?
Answer:
Given data,
60 grams, 63 grams, 61 grams, 58 grams, 65 grams, 60 grams, and 60 grams.
60 grams – 3
Thus the mode of the data is 3.
D. What is the median of the data?
Answer:
Given data,
60 grams, 63 grams, 61 grams, 58 grams, 65 grams, 60 grams, and 60 grams.
First, arrange the given data in ascending order.
58, 60, 60, 60, 61, 63, 65
median = 60
E. Which measures of the center are the same?
Answer: 60 grams
Question 2.
Reason Jackson recorded the following data: 2, 5, x, 2, 4, 3. If the mean of the data is 3, what is the value of x? Explain how you found your answer.
Answer:
Mean = sum of observations/number of observations
mean = 3
mean = (2+5+x+2+4+3)/6
3 = (2+5+x+2+4+3)/6
3 × 6 = 2+5+x+2+4+3
18 = 16+x
18-16 = x
x = 2
Question 3.
Math on the Spot Find the mean, median, and mode of the data set: 10, 6, 2, 3, 1, and 2.
Answer:
Given data,
10, 6, 2, 3, 1, and 2
Mean = sum of observations/number of observations
mean =(10+6+2+3+1+2)/6
mean = 24/6 = 4
Thus mean = 4
First, arrange the given data in ascending order.
1, 2, 2, 3, 6, 10
Median = 2+3/2 = 5/2 = 2.5
Mode = 2
Thus mode of the given data is 2.
For Problems 4-7, find the mean, median, and mode of each data set.
Question 4.
17, 25, 23, 200, 14
Mean: ___________
Median: ___________
Mode: ___________
Answer:
Given data,
17, 25, 23, 200, 14
Mean = sum of observations/number of observations
mean = (17+25+23+200+14)/5
mean = 68
First, arrange the given data in ascending order.
14, 17, 23, 25, 200
Median = 23
Mode = 14, 17, 23, 25, 200
Question 5.
0.5, 1.4, 3.0, 7.0, 0.5, 1.8, 0.5
Mean: ___________
Median: ___________
Mode: ___________
Answer:
Given data,
0.5, 1.4, 3.0, 7.0, 0.5, 1.8, 0.5
Mean = sum of observations/number of observations
mean = (0.5+1.4+3+7+0.5+1.8+0.5)/7
mean = 2.1
First, arrange the given data in ascending order.
0.5, 0.5, 0.5, 1.4, 1.8, 3, 7
Median = 1.4
0.5 is repeated 3 times so the mode is 0.5.
Mode = 0.5
Question 6.
1, 8, 5, 4, 1, 8, 5, 4
Mean: ___________
Median: ___________
Mode: ___________
Answer:
Given data,
1, 8, 5, 4, 1, 8, 5, 4
Mean = sum of observations/number of observations
mean = (1+8+5+4+1+8+5+4)/8
mean = 45
First, arrange the given data in ascending order.
1, 1, 4, 4, 5, 5, 8, 8
Median = (4 + 5)/2 = 9/2 = 4.5
Mode = 1, 4, 5, 8 becuase it is repeated 2 times.
Question 7.
0, 78, 99, 58, 65, 0, 47, 38, 227
Mean: ___________
Median: ___________
Mode: ___________
Answer:
Given data,
0, 78, 99, 58, 65, 0, 47, 38, 227
Mean = sum of observations/number of observations
mean = (0+78+99+58+65+47+38+227)9 = 68
First, arrange the given data in ascending order.
0, 0, 38, 47, 58, 65, 78, 99, 227
Median = 58
Mode = 0
Test Prep
Question 8.
The ages of dogs (in years) at a dog shelter are shown.
7, 4, 6, 8, 8, 7, 3, 5, 4, 2
What is the mode of the data? Select all that apply.
(A) 2 years
(B) 3 years
(C) 4 years
(D) 7 years
(E) 8 years
Answer:
Given data,
7, 4, 6, 8, 8, 7, 3, 5, 4, 2
Mode = 7, 4, 8 because there are two 7s, two 4s, two 8s/
Thus the correct answer is options C, D, and E.
Question 9.
In their most recent tournament, the winning team’s 6 members had the scores shown.
70, 72, 74, 76, 80, 132
Which statement is correct?
(A) The median is 74.
(B) The mean is 75.
(C) The median is 76.
(D) The mean is 84.
Answer: (D) The mean is 84.
Explanation:
Mean = sum of observations/number of observations
Mean = 70+72+74+76+80+132/6 = 84
Median = 74+76/2 = 75
Mode = 70, 72, 74, 76, 80, 132
So, the correct statement is option D (The mean is 84.)
Question 10.
What is the median of the data?
3, 5, 6, 7, 9, 6, 8, 7, 8, 12
(A) 6
(B) 7
(C) 7.1
(D) 8
Answer:
Given data,
3, 5, 6, 7, 9, 6, 8, 7, 8, 12
First, arrange the given data in ascending order.
3, 5, 6, 6, 7, 7, 8, 8, 9, 12
median = (7 + 7)/2 = 14/2 = 7
Thus the median of the data is 7.
Option B is the correct answer.
Spiral Review
Question 11.
A parallelogram has a base of 13 centimeters and a height of 9.2 centimeters. What is the area of the parallelogram?
Answer:
Given,
A parallelogram has a base of 13 centimeters and a height of 9.2 centimeters.
We know that,
Area of the Parallelogram = Bh
A = 13 × 9.2
A = 119.6 square centimeters
Thus the area of the parallelogram is 119.6 square centimeters.
Question 12.
In which quadrant is the point (-5, 1.7) located?
Answer:
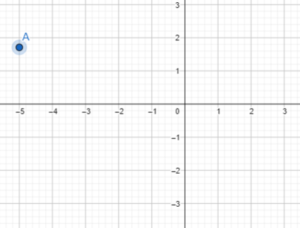
So, the point (-5, 1.7) is located in quadrant-II.