We included HMH Into Math Grade 2 Answer Key PDF Module 3 Lesson 2 Interpret Picture Graphs to make students experts in learning maths.
HMH Into Math Grade 2 Module 3 Lesson 2 Answer Key Interpret Picture Graphs
I Can read a picture graph and use it to solve problems.

Spark Your Learning
How many fewer red marbles than blue marbles doesYumi have?
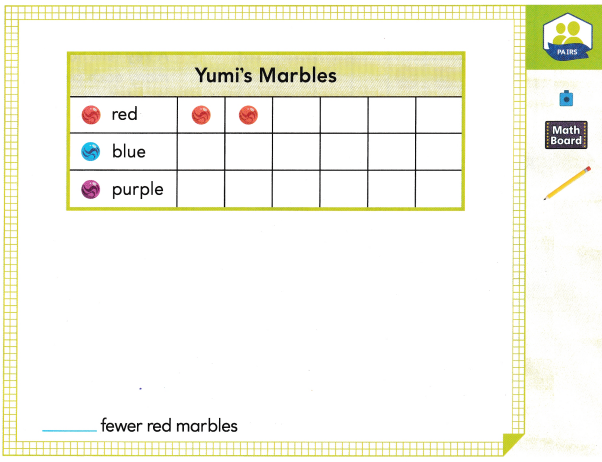
Answer:
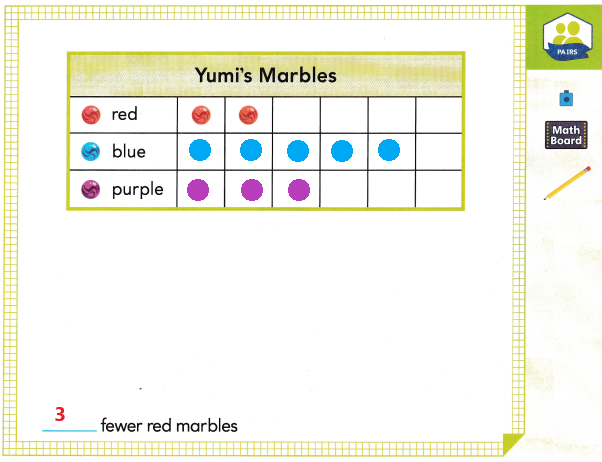
Explanation:
There are 3 fewer red marbles than blue marbles.
Read the following: Yumi has 10 marbles. She has 2 red marbles and 5 blue marbles. The rest of the marbles are purple. How can you complete the picture graph to show Yumi’s marbles? How many fewer red marbles than blue marbles does Yumi have?
Build Understanding
Tanya and her friends made a picture graph to show the points they each scored while playing basketball.
A. How can you use the pictures in the graph to find how many points Tanya and her friends scored?
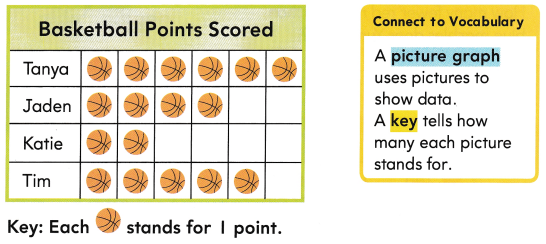
Tanya: ___ points Jaden : ___ points
Katie: ___ points Tim : ___ points
Answer:
Tanya: 6 points
Jaden : 4 points
Katie: 2 points
Tim : 5 points
B. How can you use the data in the picture graph to solve problems?
- How many points in all did Jaden and Katie score?
___ + ___ = __ points
Answer:
4 + 2 = 6 points
Jaden and Katie scored 6 points - How many more points did Tanya score than Katie?
___ – ___ = ___ more points
Answer:
6 + 2 = 8
Tanya and Katie scored 8 points.
Turn and Talk What does each basketball picture stand for? Explain how you know.
Step It Out
1. The picture graph shows the number of home runs each child hit playing baseball.
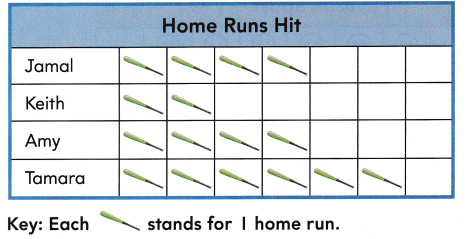
A. Use the graph. Write how many home runs each child hit.
Jamal: ___ home runs Keith: ___ home runs
Amy: ___ home runs Tamora: ___ home runs
Answer:
Jamal: 4 home runs
Keith: 2 home runs
Amy: 4 home runs
Tamora: 6 home runs
B. Use the data from the picture graph to solve the problem.
How many fewer home runs did Jamal hit than Tamara? ____ fewer home runs
Answer:
2 fewer home runs
Explanation:
Tamara scored 6, Jamal scored 4
6 – 4 = 2
2 fewer home runs
Check Understanding
Use the picture graph above to solve the problems.
Question 1.
Who hit the fewest home runs? ____
Answer:
Keith hit the fewest home runs that is 2 runs.
Question 2.
How many home runs did Jamal and Keith hit? __ home runs
Answer:
6
Explanation:
Jamal: 4 home runs
Keith: 2 home runs
4 + 2 = 6
On Your Own
Use the picture graph to solve the problems.
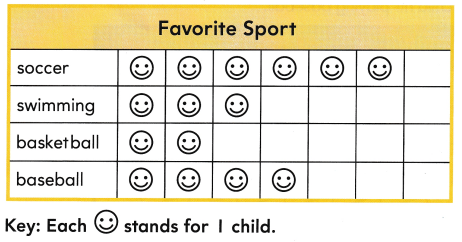
Question 3.
Use Tools How many children chose soccer or baseball? ___ children
Answer:
10 children
Explanation:
6 children chose soccer, 4 children chose baseball
6 + 4 = 10
10 children chose soccer or baseball.
Question 4.
Attend to Precision How many more children chose soccer than swimming? ___ more children
Answer:
3 more children
Explanation:
6 children chose soccer, 3 children chose swimming
6 – 3 = 3
3 more children chose soccer than swimming.
Question 5.
Which two sports were chosen by a total of 7 children? _____
Answer:
Baseball and swimming
Explanation:
4 children baseball, 3 children chose swimming
4 + 3 = 7.
Question 6.
Reason Two children change their favorite sport from baseball to basketball. Now how many children choose baseball? ___ children
Answer:
2 children
Explanation:
4 children chose baseball, if 2 change to basket ball then
4 – 2 = 2
2 children chose baseball now.
I’m in a Learning Mindset!
What about interpreting picture graphs made me feel good about my learning?
____________________________________________________________________