We included HMH Into Math Grade 2 Answer Key PDF Module 3 Lesson 3 Draw Picture Graphs to Represent Data to make students experts in learning maths.
HMH Into Math Grade 2 Module 3 Lesson 3 Answer Key Draw Picture Graphs to Represent Data
I Can draw a picture graph to show data, and then use the graph to solve problems.
Spark Your Learning
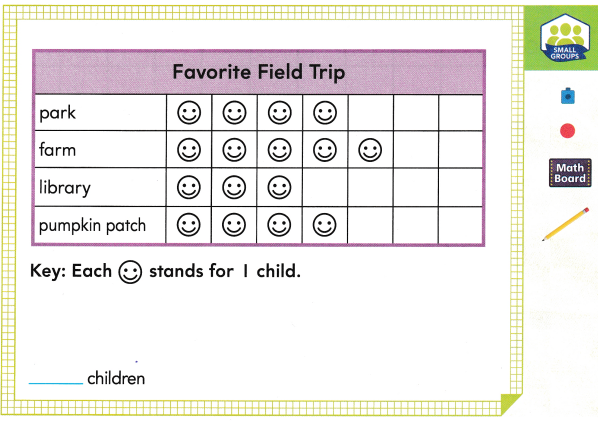
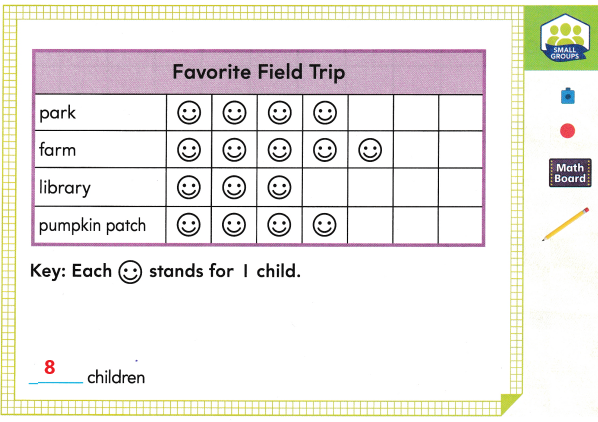
How can you show your favorite place to go on a field trip on the picture graph below?
Answer:
Explanation:
4 children chose park, 4 chose pumpkin patch
4 + 4 = 8
8 children chose park or pumpkin patch.
Read the following: Mrs. Morgan asked the children in her class to choose their favorite place to go on a field trip. The data are shown in the graph. Have children work in small groups. Ask each child to use the graph to show his or her favorite place to go on a field trip. Then have children use the updated graph to find the number of children who chose a park or a pumpkin patch.
Build Understanding
Carter and his friends went to a carnival. They played games and won prizes. Carter won 4 prizes. Lena won 7 prizes. Jennie won 3 prizes. Shaun won 6 prizes. Draw a picture graph to show this data.

A. How can you draw pictures to show how many prizes Carter won?
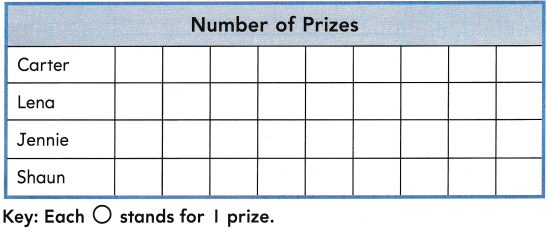
B. How can you draw pictures in the rows for Lena, Jennie, and Shaun to show how many prizes
they each won?
Answer:
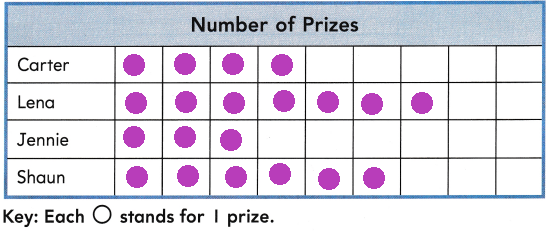
C. How many more prizes did Lena win than Jennie?
__________________________________
__________________________________
Answer:
4 more prizes
Explanation:
Leena won 7 prizes, Jennie won 3 prizes7 – 3 = 4
4 more prizes Leena won than Jennie.
Turn and Talk How does the key help you draw pictures in the graph?
Step It Out
1. Zoey asked her classmates to choose their favorite breakfast food. Draw a picture graph to show the data.
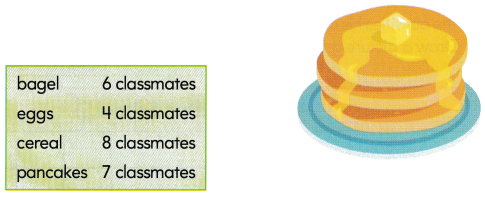
A. Start with the row for bagel. Draw I © to stand for each classmate who chose that breakfast food.
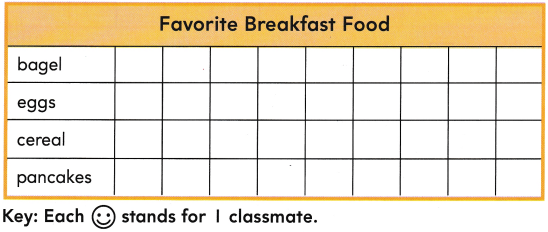
B. Draw pictures in the rows for eggs, cereal, and pancakes to show how many classmates chose each of those breakfast foods.
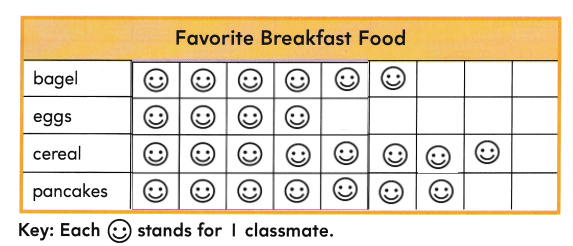
Answer:
Check Understanding Math Board
Question 1.
Use the picture graph above. How many fewer classmates chose eggs than pancakes?
____ fewer classmates
Answer:
3 fewer classmates
Explanation:
4 chose eggs, 7 chose pancakes
7 – 4 = 3
3 fewer classmates chose eggs than pancakes.
On Your Own
Question 2.
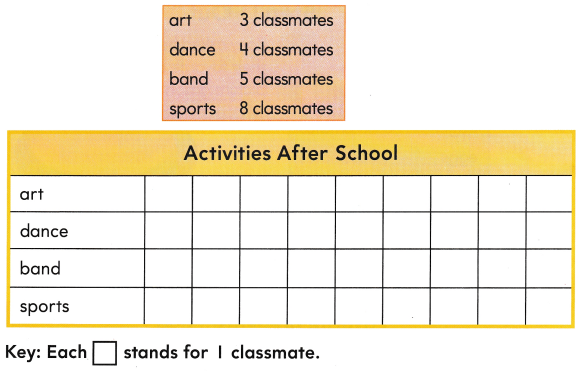
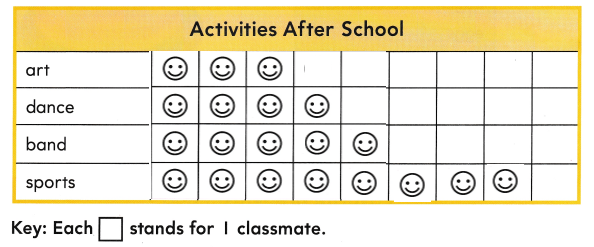
Use Structure Isaac made a list to show the activities his classmates do after school. Draw a picture graph to show the data.
Answer:
Question 3.
Attend to Precision How many more classmates are ¡n sports than art? ___ more classmates
Answer:
5 more classmates
Explanation:
8 chose sports, 3 chose art
8 – 3 = 5.
Question 4.
How many classmates did Isaac survey? ___ classmates
Answer:
20 classmates
Explanation:
3 + 4 + 5 + 8 = 20
Question 5.
Open Ended Write a new question that you could answer using the graph. Then solve.
Answer:
How many classmates chose dance?
Answer:
4 classmates.
I’m in a Learning Mindset
How did drawing a picture graph challenge me?
_______________________________