We included HMH Into Math Grade 2 Answer Key PDF Module 18 Lesson 4 Make Line Plots to Show Measurement Data to make students experts in learning maths.
HMH Into Math Grade 2 Module 18 Lesson 4 Answer Key Make Line Plots to Show Measurement Data
I Can measure the length of objects in inches and show the data on a line plot.
Spark Your Learning
How long are Maria’s caterpillars?
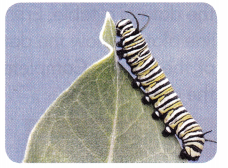
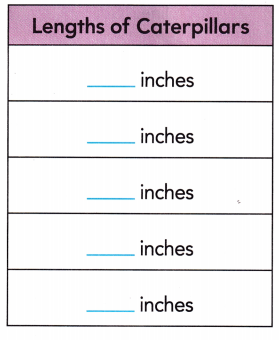
Give each group five chenille sticks cut to varying lengths from 1 to 5 inches. There is no need to provide every group with the same lengths. Maria is working on a project about caterpillars. She needs to measure their lengths. The chenille sticks are the same lengths as Maria’s caterpillars. How can you use these chenille sticks to find the lengths of Maria’s caterpillars? Record the information in the table.
Answer:
Explanation:
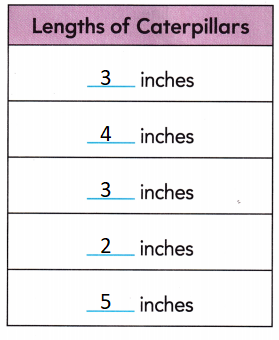
chenille sticks cut to varying lengths from 1 to 5 inches
so, 2 are of same length that is 3 inches,
1 caterpillar is 3 inches and one more caterpillar is 5 inches.
Build Understanding
Question 1.
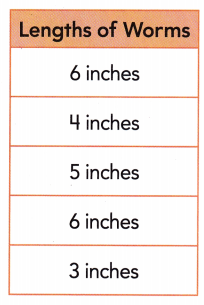
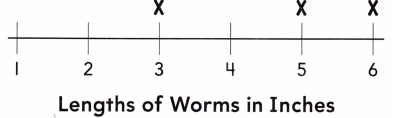
Erik’s class measured worms and recorded the data in a table. Erik started to make a line plot to show the data about the lengths of the worms. Complete the line plot to show the data.
Connect to Vocabulary
A line plot shows data on a number line.
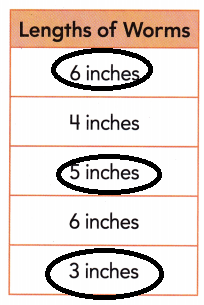
A. Which lengths from the table are already shown on the line plot? Circle them in the table.
Answer:
B. Which lengths are missing from the line plot?
Answer:
4 inches and 6 inches are missing in the line plot.
C. How can you show these lengths on the line plot?
Answer:
Yes, she can plot the lengths.
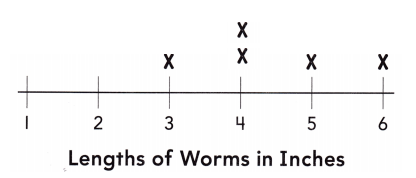
D. Complete the line plot.
Answer:
Turn and Talk How is a line plot helpful when you wont to organize data?
Answer:
According to the data table the worm sizes are plotted on the line plot.
Step It Out
Question 1.
Some birds use yarn to build their nests. To help, people may put out a bird feeder filled with small pieces of yarn. Make a line plot to show lengths of yarn for a bird feeder.
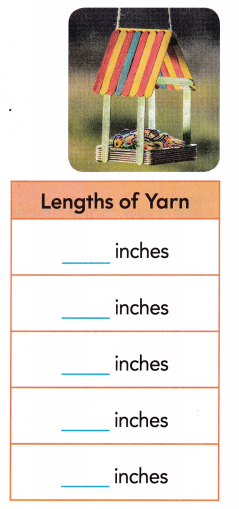
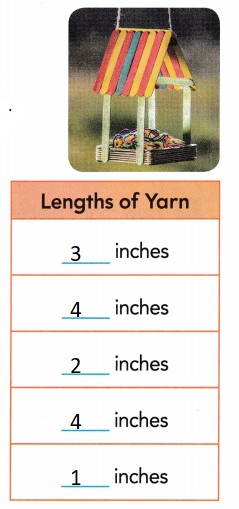
A. Measure 5 pieces of yarn with an inch ruler. Record the lengths in the table.
Answer:
B. Write a title for the line plot.
THINK: What did I measure?
Answer:
C. Label the line plot with numbers for the lengths.
THINK: Start with the smallest measurement.
Answer:
1 is the smallest measurement
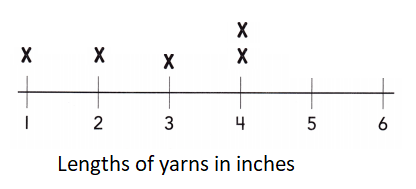
D. Draw an X on the line plot for each measurement.
Answer:
Explanation:
The lengths of the yarns are measured in inches,
and plotted them on line plot.
Turn and Talk How would this line plot change if you measured 7 pieces of yarn instead of 5 pieces?
Answer:
The number of dots on the line plot will change from 5 to 7.
Question 2.
Use the line plot you made to answer the qes1ions.
A. How long was your longest piece of yam?
_________ inches
Answer:
4 inches is the longest piece of yam
B. How many pieces of yam were measured in all?
_________ pieces
Answer:
5 pieces.
Explanation:
4 inches is the longest piece of yam and 1 inch is the shortest piece of yam.
There are 5 pieces of yam that we have measured.
Check Understanding
Question 1.
Connor and Emily are measuring ribbons for a project. Measure the ribbons with an inch ruler. Record the lengths in inches.

Answer:
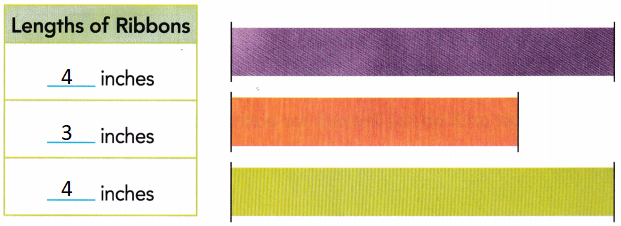
Explanation:
Purple and yellow flags are of same sizes both are 4 inches long.
and orange ribbon is 3 inches.
Question 2.
Label the line plot below with a title and numbers for the lengths. Draw an X on the line plot for each length.
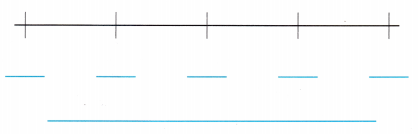
Answer:
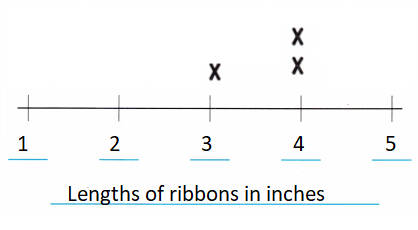
Explanation:
The lengths of the ribbon are plotted on the line plot.
Purple and yellow flags are of same sizes both are 4 inches long.
and orange ribbon is 3 inches.
On Your Own
Question 3.
Attend to Precision Use an inch ruler to measure 4 books in your classroom. Record the lengths.
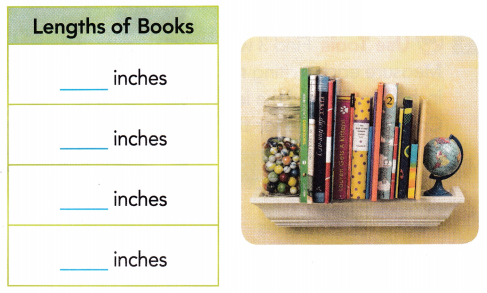
Answer:
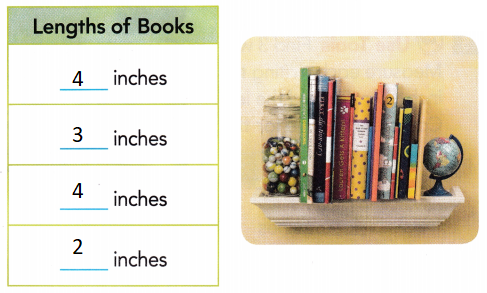
Explanation:
I have choose 4 books from my and measured it with a ruler
Question 4.
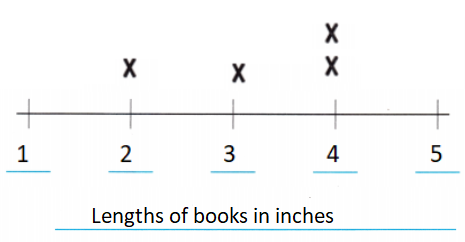
Attend to Precision Make a line plot. Write a title. Label the line plot with numbers for the lengths. Draw an X on the line plot for each length.
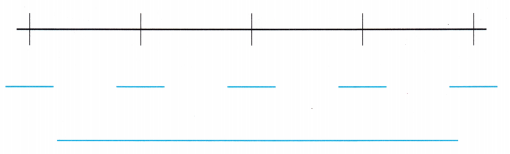
Answer:
Explanation:
I have choose 4 books from my and measured it with a ruler
The lengths are plotted on the line plot
There are 2 books of 4 inches and 1 books of 2 inches and 1 books of 3 inches.
Question 5.
Use Tools Find 3 writing tools. Measure each writing tool with an inch ruler. Record the lengths. Complete the title for the table.
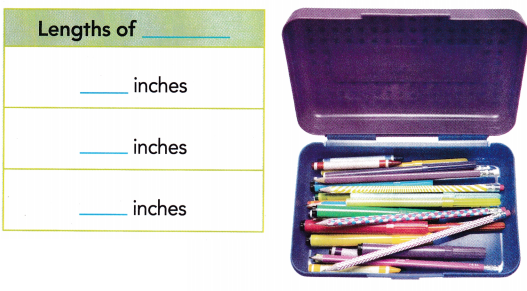
Answer:
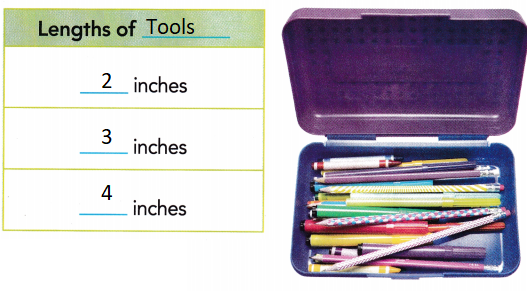
Explanation:
We have choose 3 tools of writing they are a eraser, crayon and a pen
The are of different lengths marked in the data table.
Question 6.
Attend to Precision Make a line plot. Write a title. Label the line plot with numbers for lengths. Draw an X on the line plot for each length.
Answer:
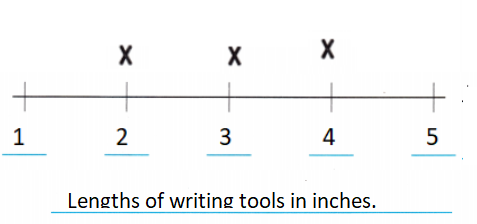
Explanation:
The eraser is of 2 inches long
A crayon is 3 inches long and a pen is of 4 inches long.
I’m in a Learning Mindset!
What helps me stay on task?
Answer:
Concentration helps me to stay on task.