We included HMH Into Math Grade 1 Answer Key PDF Module 8 Lesson 6 Represent Data with Bar Graphs to make students experts in learning maths.
HMH Into Math Grade 1 Module 8 Lesson 6 Answer Key Represent Data with Bar Graphs
I Can make a bar graph to organize information and use it to answer questions.
Spark Your Learning
Some children were asked what sport they like best.

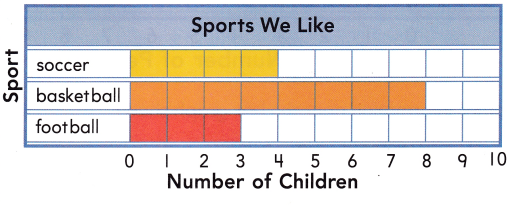
Children work in pairs. Each child chooses the sport he or she likes best and changes the bar graph to show his or her choice. Ask them to write a question that can be answered by using one of the categories they changed, and answer the question.
Answer:
How many children chose football as their favorite sport?
Explanation:
There are 3 bars colored against football
So, 3 children chose football as their favorite sport.
Build Understanding

A. How can you draw bars to show the number of cats and the number of dogs?
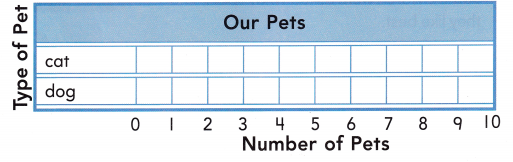
What other information does the bar graph show?
Answer:
Explanation:
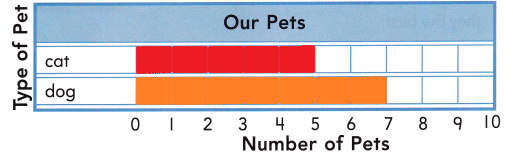
In the above picture there are 5 cats and 7 dogs.
So, i drew a bar graph using the information in the picture
B. How many pets are there?
________ pets
Answer:
12 pets
Explanation:
In the above picture there are 5 cats and 7 dogs.
5 + 7 = 12
So, there are 12 pets in all.
C. Are there more cats or dogs?
How many more?
Equation: __________
___________ more
Answer:
There are more dogs
2 more
Explanation:
In the above picture there are 5 cats and 7 dogs
There are more number of dogs than cats
7 – 5 = 2
So, there are 2 more dogs than cats.
Turn and Talk How is making a bar graph like making a picture graph? How is it different?
Answer:
A picture graph displays data using symbols or pictures to represent the numbers. A bar graph is a graph that compares amounts in each category to each other using bars.
A picture graph displays data using symbols or pictures to represent the numbers. A bar graph is a graph that compares amounts in each category to each other using bars.
Step It Out
Question 1.
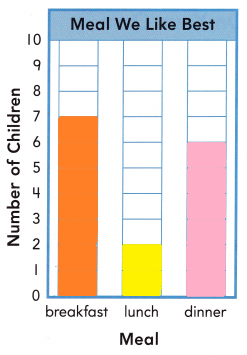
Children were asked to choose the meal they like best.
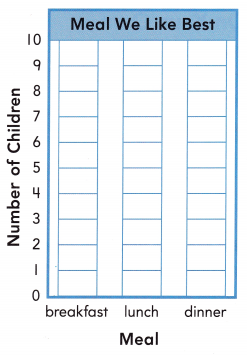
- 7 chose breakfast.
- 2 chose lunch.
- 6 chose dinner.
A. Draw bars to show the data.
THINK: Draw a bar to show each number.
Answer:
Explanation:
I made a bar model using the information about the choice of their meal.
Check Understanding
Use your bar graph to answer the questions.
Question 1.
How many children chose breakfast or lunch?
_________ children
Answer:
9 children
Explanation:
7 children chose breakfast
2 children chose lunch
7 + 2 = 9
So, 9 children chose breakfast or lunch.
Question 2.
Did fewer children choose lunch or dinner?
Answer:
Fewer children chose lunch than dinner.
Explanation:
6 children chose dinner
2 children chose lunch
2 < 6
So, fewer children chose lunch than dinner.
Question 3.
How many more children chose breakfast than dinner?
__________ more
Answer:
1 more child chose breakfast than dinner
Explanation:
7 children chose breakfast
6 children chose dinner
7 – 6 = 1
So, 1 more child chose breakfast than dinner.
On Your Own
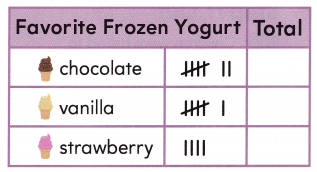
The tally chart shows how many children like each flavor of frozen yogurt.
Question 4.
Reason Use the information in the tally chart to make a bar graph.
Answer:
Explanation:
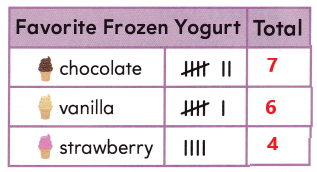
I completed the tally chart using the tally marks.
I counted the number of tally marks and wrote the total.
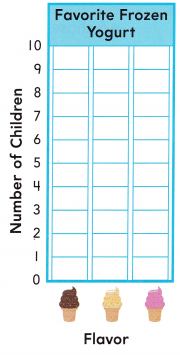
Use the bar graph to answer the question.
Answer:
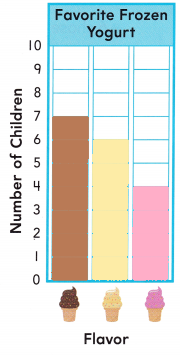
Explanation:
I made a bar graph using the information in the tally chart.
7 children chose chocolate, 6 chose butterscotch and 4 chose strawberry.
Question 5.
Model with Mathematics How many more children would need to choose strawberry to have the same number as chocolate? Write an addition equation to explain.
Equation: ___________
________ more children
Answer:
3 children
Explanation:
7 children chose chocolate
4 children chose strawberry
4 + 3 = 7
So, 3 more children should chose strawberry to have the same number as chocolate.
I’m in a Learning Mindset!
What questions can I ask to help me make bar graphs?
Answer: