We included HMH Into Math Grade 1 Answer Key PDF Module 8 Lesson 5 Interpret Bar Graphs to make students experts in learning maths.
HMH Into Math Grade 1 Module 8 Lesson 5 Answer Key Interpret Bar Graphs
I Can read a bar graph and use the graph to answer questions.
Spark Your Learning
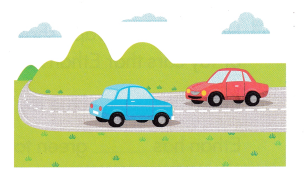
Rashida counted all the red cars and blue cars that drove by. The tally chart shows what she saw.
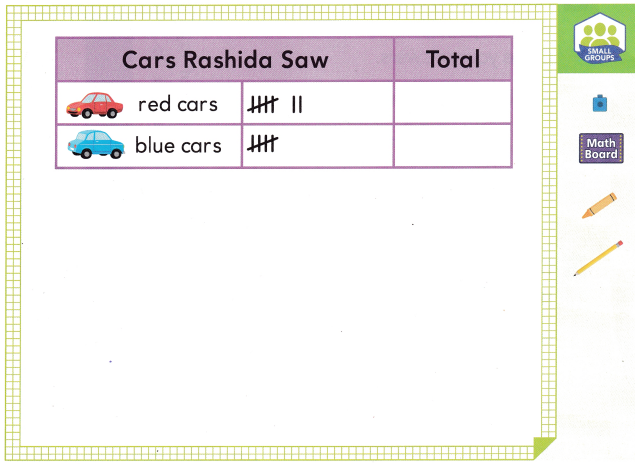
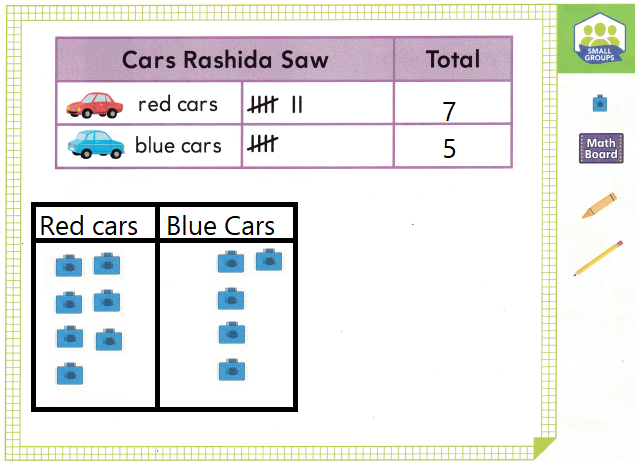
Have children complete the tally chart. Then ask children how they could use connecting cubes to compare the numbers of red cars and blue cars Rashida saw. Have children draw to show what they did.
Answer:
Explanation:
no, The children didn’t completed the tally chart.
they haven’t written the total
One line represents as 1 car
They shown the same with base blocks also.
Build Understanding
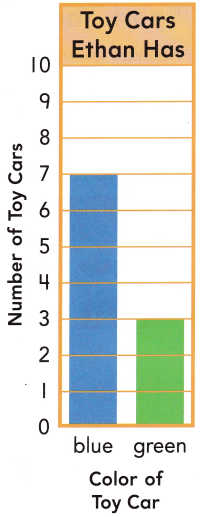
Ethan made a bar graph to show the number of blue and green toy cars he has.
A. How does the graph show the number of toy cars that Ethan has?
Ethan has __ blue toy cars.
Ethan has ___ green toy cars.
Explanation:
Ethan has 7 blue toy cars.
Ethan has 3 green toy cars.
The blue color represents number of blue cars and
green color represent number of green cars
Blue color is shaded up to the mark 7
and green color is shaded up to the mark 3.
B. How does the bar graph help you compare the information? Circle your answers.
- Which bar is longer?
blue bar green bar
Answer:
- What does a longer bar show?
more fewer
Answer:
Explanation:
In the above bar graph blue bar is longer than the green bar
The longer bar has more.
Blue color is shaded up to the mark 7
and green color is shaded up to the mark 3.
C. Does Ethan have more blue toy cars or green toy cars? ____ toy cars
- How can you write an equation to find how many more?
Equation: ____
___ more
Answer:
Blue toy cars
Explanation:
Let n be the unknown how many number of cars
n = number of blue cars – number of green cars
n = 7 – 3
n = 4
There are 4 more cars of blue than green cars
Turn and Talk How does a bar in a bar graph show the number of items?
Explanation:
A bar graph is a chart that plots data using rectangular bars or columns (called bins) that represent the total amount of observations in the data for that category.
Step It Out
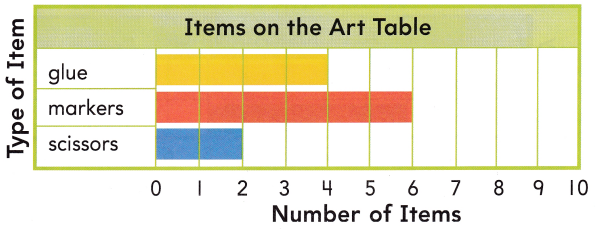
A. Use the bar graph to find how many.
How many markers are there? ___ markers
How many items are on the table? ____ items
Answer:
There are 6 markers.
Number of glue = 4
Number of markers = 6
Number of scissors = 2
let n be the Total number of items = Number of glue + Number of markers + Number of scissors
n = 4 + 6 + 2
n = 12
B. Use the bar graph to compare.
How many more markers are there than scissors? __ more
Explanation:
Number of markers = 6
Number of scissors = 2
let n be the number of items that are more.
n = Number of markers – Number of scissors
n = 6 – 2
n = 4
Check Understanding Math Board
Use the bar graph to answer the questions.
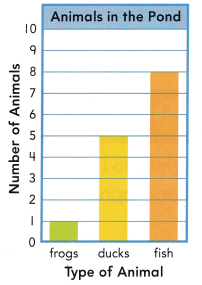
Question 1.
How many frogs and ducks are there?
___ frogs and ducks
Answer:
Answer:
there are 6 frogs and ducks in all
Explanation:
Let total number of frogs and ducks be n
n = number of frogs + number of ducks
n = 1 + 5
n = 6
total number of frogs and ducks = 6
Question 2.
How many fewer frogs are there than fish?
___ fewer frogs
Answer:
7 fewer frogs are there than fish
Explanation:
Let n be the fewer number of frogs
number of frogs = 1
number of fishes = 8
n = 8 – 1
n = 7
On Your Own
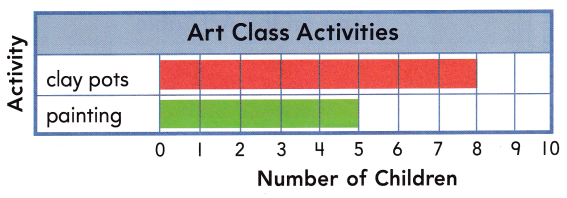
Question 3.
Reason There are 12 children in art class. 5 children paint. The rest make clay pots. Andy made this bar graph to show the data. He made a mistake. Explain the mistake Andy made.
Answer:
Total number of children in art class be n
number of children do paint is 5
let n be the number of children who do clay pot
n = 12 – 5
n = 7
Explanation:
In the above graph the Andy made the clay pot marking up to 8
But the children who do clay pot are only 7
so, the Andy made the mistake he marked up to point 8
I’m in a Learning Mindset!
What do I already know that can help me understand bar graphs?
Explanation:
A bar diagram makes it easy to compare sets of data between different groups at a glance. The graph represents categories on one axis and a discrete value in the other. The goal is to show the relationship between the two axes. Bar charts can also show big changes in data over time.