We included HMH Into Math Grade 1 Answer Key PDF Module 8 Lesson 1 Interpret Picture Graphs to make students experts in learning maths.
HMH Into Math Grade 1 Module 8 Lesson 1 Answer Key Interpret Picture Graphs
I Can read a picture graph and use the graph to answer questions, such as how many more.
Spark Your Learning
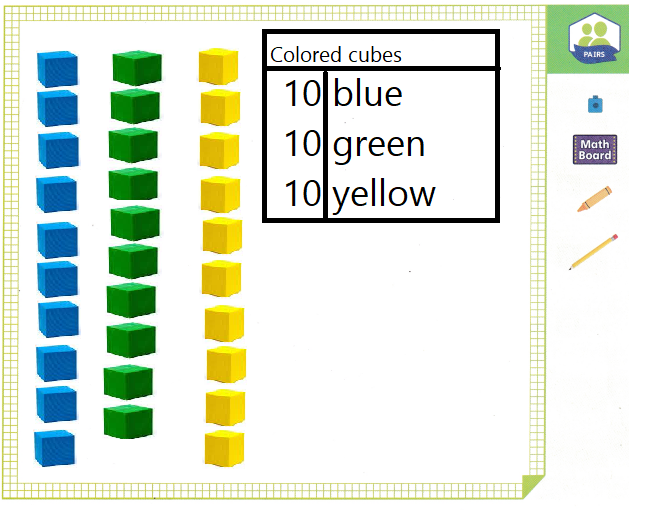
Start with 10 cubes. How can you sort the cubes?
Give pairs of children a group of 10 cubes in a random mix of three colors. Ask children to arrange their group of cubes to show how many cubes of each color they have and draw to show what they did.
Answer:
Explanation:
10 cubes of each color they have and drawn to show what they did.
3 colors they are mixed randomly are blue, green and yellow
so, the children have arranged in this way.
Build Understanding
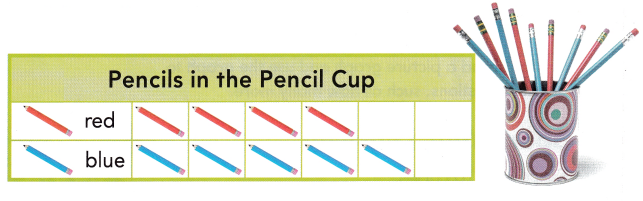
A. What does this picture graph show?
Answer:
Number of pencils in the pencil cup
and how many colors of pencils are there
how many pieces with single color
B. How many ![]() are there?
are there? ![]()
Answer:
There are 4 red color pencils
C. How many ![]() are there?
are there? ![]()
Answer:
There are 5 blue color pencils
D. Are there more ![]() or
or ![]() ? Circle your answer. How many more? __ more
? Circle your answer. How many more? __ more
Explanation:
There are 4 red color pencils
There are 5 blue color pencils
Let n be the that are more
n = 5 – 4
n = 1
so, there are more blue color pencils.
Turn and Talk How did the picture graph help you answer the questions?
Explanation:
A picture graph, or pictograph, is a graph used to display information that uses images or symbols to represent data.
Step It Out
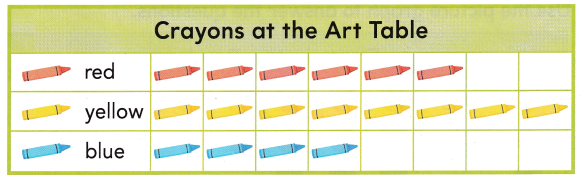
A. How many crayons are there?
THINK: Count all the crayons. ____ crayons
Explanation:
Number of blue crayons = 4
Number of red crayons = 6
Number of yellow crayons = 8
B. How many fewer ![]() are there than
are there than ![]() ? Write an equation to show how you know.
? Write an equation to show how you know.
____ – ___ = ___
____ fewer ![]()
Answer:
2 fewer ![]()
Explanation:
Number of blue crayons = 4
Number of red crayons = 6
let n be that are fewer
n = 6 – 4
n = 2
Check Understanding Math Board
Use the picture graph to answer the questions.
Question 1.
How many ![]() are there? ___
are there? ___ ![]()
Answer:
Number of red crayons = 6
According to the data in the picture graph there are 6 red crayons
Question 2.
How many ![]() and
and ![]() are there? ___
are there? ___ ![]() and
and ![]()
Answer:
12 ![]() and
and ![]()
Explanation:
Number of yellow crayons = 8
Number of blue crayons = 4
Let n be the total blue and yellow
n = 8 + 4
n = 12
Question 3.
How many more ![]() are there than
are there than ![]() ? ___ more
? ___ more ![]()
Answer:
4 more ![]()
Explanation:
Number of yellow crayons = 8
Number of blue crayons = 4
Let n be the more yellow than blue
n = 8 – 4
n = 4
On Your Own
Use the picture graph to answer the questions.
Question 4.
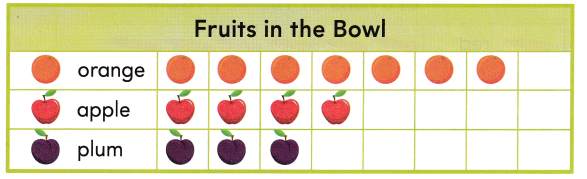
How many fruits are in the bowl? ___ fruits
Answer:
14 fruits.
Explanation:
Number of oranges in the bowl = 7
Number of apple in the bowl= 4
Number of plum in the bowl = 3
let n be total fruits in the bowl
n = 7 + 4 + 3
n = 14
Question 5.
Attend to Precision How many more ![]() are there than
are there than ![]() ? ___ more
? ___ more ![]()
Answer:
3 more ![]()
Explanation:
Number of oranges in the bowl = 7
Number of apple in the bowl= 4
let n be fruits that are more.
n = 7 – 4 = 3
n = 3
Question 6.
Construct Arguments What if there were 3 more ![]() ? How would the number of
? How would the number of ![]() compare
compare
to the number of ![]() now? Write to explain.
now? Write to explain.
Answer:
oranges are equal to apples.
Explanation:
Number of apple in the bowl= 4
3 more are added
4 + 3 = 7
Number of oranges in the bowl = 7
if we compare the both
7 = 7
I’m in a Learning Mindset!
What parts of interpreting picture graphs do I need help with?
Explanation:
we learned that a picture graph typically has two axes, a scale, pictures that can be arranged vertically or horizontally, and a title