We included HMH Into Math Grade 1 Answer Key PDF Module 8 Lesson 2 Represent Data with Picture Graphs to make students experts in learning maths.
HMH Into Math Grade 1 Module 8 Lesson 2 Answer Key Represent Data with Picture Graphs
I Can make a picture graph to organize information and use the graph to answer questions.
Spark Your Learning
Some children were asked to choose which shape they like best. They made a picture graph to show the data.

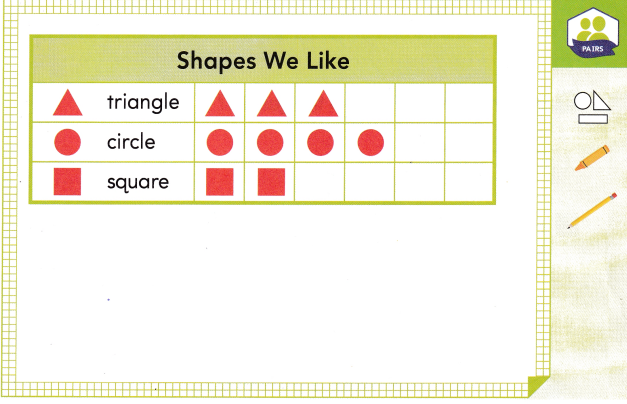
Children work in pairs. Each child chooses the shape he or she likes best and draws it in the graph to show his or her choice. Ask children to find which shape more children like and draw or write to show how they know.
Explanation:
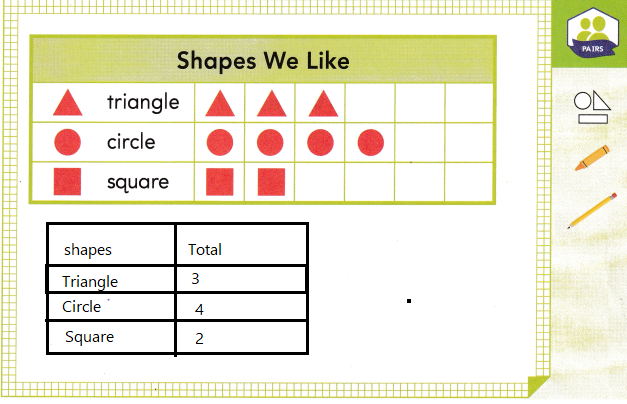
Number of children choose tringle = 3
Number of children choose circle = 4
Number of children choose square = 2
Build Understanding
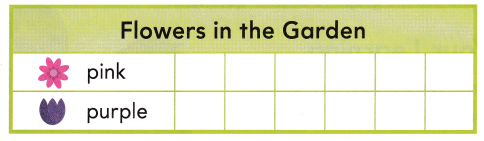
Amir wants to make a picture graph to show the flowers in the garden.

A. How many ![]() will you draw in the graph?
will you draw in the graph?
How many ![]() will you draw in the graph?
will you draw in the graph?
Explanation:
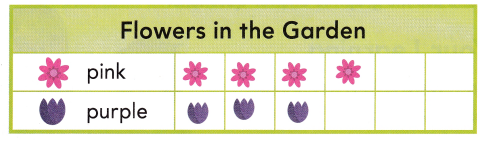
B. How many flowers are in the garden?
___ flowers
Answer:
7 flowers
Explanation:
Number of flowers in pink are 4
Number of flowers in purple are 3
total number of flowers be n
n = 4 + 3
n = 7
C. How many fewer ![]() are there than
are there than ![]() ? How can you write an equation to show how you know?
? How can you write an equation to show how you know?
____ – ___ = ____
___ fewer ![]()
Answer:
4 – 3 = 1
1 fewer ![]()
Explanation:
Number of flowers in pink are 4
Number of flowers in purple are 3
let n be the number of flowers that are fewer
n = 4 – 3
n = 1
Turn and Talk What is another question you could answer by using the picture graph?
Explanation:
How many more ![]() are there than
are there than ![]()
Step It Out
1. Joy kept track of the weather for two weeks. She recorded 7 sunny days, 14 rainy days. and 3 cloudy days. Make a picture graph to show the data.
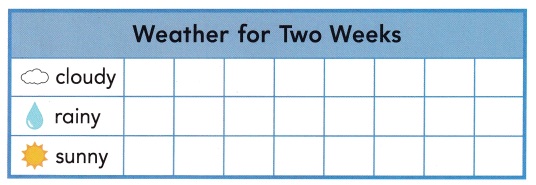
A. Draw a ![]() in the graph for each sunny day.
in the graph for each sunny day.
B. Draw a ![]() in the graph for each rainy day.
in the graph for each rainy day.
C. Draw a ![]() in the graph for each cloudy day.
in the graph for each cloudy day.
Explanation:
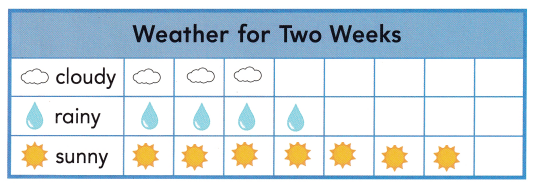
Number of cloudy days in the 2 weeks are 3
Number of rainy days in the 2 weeks are 4
Number of sunny days in the 2 weeks are 7
Check Understanding Math Board
Use your picture graph to answer the questions.
Question 1.
How many days did Joy record the weather?
___ days
Answer:
14 days
Explanation:
Number of cloudy days in the 2 weeks are 3
Number of rainy days in the 2 weeks are 4
Number of sunny days in the 2 weeks are 7
let the total number of days be n
n = 3 + 4 + 7
n = 14
Question 2.
Were there more cloudy days or sunny days?
How many more? ___ more
Answer:
4 more sunny days than cloudy days.
Explanation:
Number of sunny days in the 2 weeks are 7
Number of cloudy days in the 2 weeks are 3
Let n be the days that are fewer
n = 7 – 3
n = 4
On Your Own
Question 3.
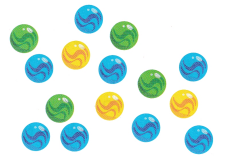
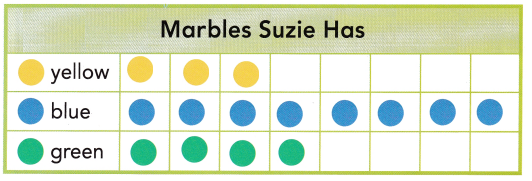
Attend to Precision Suzie has these marbles. Make a picture graph to show her marbles.
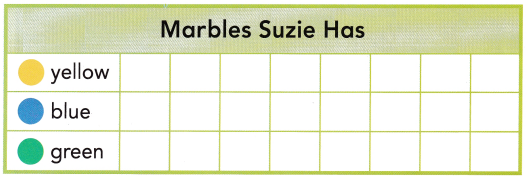
Answer:
Explanation:
Number of yellow balls that Suzie has = 3
Number of blue balls that Suzie has = 8
Number of green balls that Suzie has = 4
Question 4.
How many yellow and green marbles are there?
___ yellow and green marbles
Answer:
7 yellow and green marbles
Explanation:
Number of yellow balls that Suzie has = 3
Number of green balls that Suzie has = 4
Let n be total number of yellow and green
n = 4 + 3
n = 7
Question 5.
How many more blue marbles than yellow marbles does Suzie have? ___ more
Answer:
5 more blue marbles than yellow marbles that Suzie have
Explanation:
Number of yellow balls that Suzie has = 3
Number of blue balls that Suzie has = 8
let n be the more blue marbles than yellow marbles
n = 8 – 3
n = 5
Question 6.
Open Ended What could Suzie do to have the same number of marbles of each color?
Answer:
She has take all the marbles that are blue color
then, Suzie will have
Number of yellow balls that Suzie has = 0
Number of blue balls that Suzie has = 15
Number of green balls that Suzie has = 0
I’m in a Learning Mindset!
How did using an image help me understand making picture graphs?
Explanation:
The symbols, icons, and pictures of a picture graph typically represent concepts or ideas, or stand in for a larger quantity of something. For example, a single stick man on a picture graph could represent a million people in a city’s population.