Engage NY Eureka Math Geometry Module 3 Lesson 1 Answer Key
Eureka Math Geometry Module 3 Lesson 1 Problem Set Answer Key
Question 1.
Use the following picture to explain why \(\frac{15}{12}\) is the same as 1\(\frac{1}{4}\).

Answer:
Rectangles a, b, and c can be used to fill in the first unit square. That leaves rectangles d, e, and f, which make up one quarter of a unit square. Thus, \(\frac{15}{12}\) is the same as 1\(\frac{1}{4}\).
Question 2.
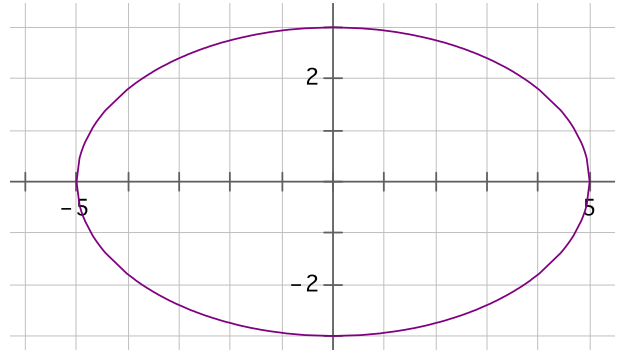
Figures 1 and 2 below show two polygonal regions used to approximate the area of the region inside an ellipse and above the x-axis.

a. Which polygonal region has a greater area? Explain your reasoning.
Answer:
The area of the polygon in Figure 1 has a greater area because it includes all of the area inside the ellipse (i.e., above the x-axis) plus some area outside of the ellipse. The polygon in Figure 2 does not even fill the region inside the ellipse (i.e., above the x-axis).
b. Which, if either, of the polygonal regions do you believe is closer in area to the region inside the ellipse and above the x-axis?
Answer:
Answers will vary.
Question 3.
Figures 1 and 2 below show two polygonal regions used to approximate the area of the region inside a parabola and above the x-axis.

a. Use the shaded polygonal region in Figure 1 to give a lower estimate of the area a under the curve and above the x-axis.
Answer:
Lower estimate: 8 square units
b. Use the shaded polygonal region to give an upper estimate of the area a under the curve and above the x-axis.
Answer:
Upper estimate: 13 square units
c. Use (a) and (b) to give an average estimate of the area a.
Answer:
Average estimate = \(\frac{1}{2}\) (lower estimate + upper estimate)
Average estimate = \(\frac{1}{2}\) (8 + 13)
Average estimate = 10.5
An average estimate of the area under the given curve above the x-axis is 10.5 square units.
Eureka Math Geometry Module 3 Lesson 1 Exit Ticket Answer Key
Question 1.
Explain how to use the shaded polygonal regions shown to estimate the area A inside the curve.

Answer:
I can use whole and half squares to determine a lower estimate of 21 square units and an upper estimate of 37 square units.
Question 2.
Use Problem 1 to find an average estimate for the area inside the curve.
Answer:
Solution: \(\frac{1}{2}\) (21 + 37) = 29
An average estimate for the area inside the curve is 29 square units.
Eureka Math Geometry Module 3 Lesson 1 Exploratory Challenge Answer Key
Exploratory Challenge 1.
a. What is area?
Answer:
Responses will vary. Expect a variety of descriptions of area. For example, “it is a space, like a picnic area” or “It is length × width.” Take a few responses and move on, as this question is more precisely answered in the Discussion following Exploratory Challenge 1.
b. What is the area of the rectangle below whose side lengths measure 3 units by 5 units?
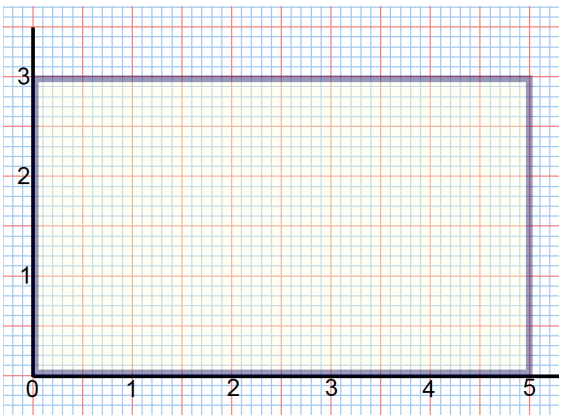
Answer:
The area is 15 square units.
c. What is the area of the \(\frac{3}{4} \times \frac{5}{3}\) rectangle below?

Answer:
\(\frac{3}{4} \times \frac{5}{3}=\frac{15}{12}=\frac{5}{4}\)
The area is \(\frac{5}{4}\) square units.
Exploratory Challenge 2
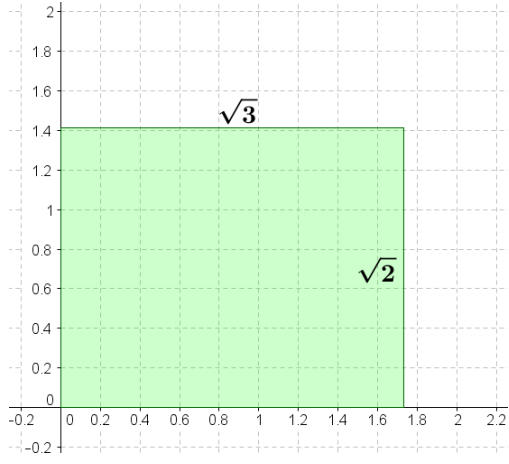
a. What is the area of the rectangle below whose side lengths measure √3 units by √2 units? Use the unit squares on the graph to guide your approximation. Explain how you determined your answer.

Answer:
Answers will vary; some students may respond with a decimal approximation, such as approximately 2.3 square units. Others might respond with the answer square units; ask students how they know in this case.
b. Is your answer precise?
Answer:
Students who offered decimal answers should recognize that their results are not precise because their side length estimations are just that: estimations of irrational values. A precise answer would be √6 square units, but again, press students for a justification for this answer.
Eureka Math Geometry Module 3 Lesson 1 Discussion Answer Key
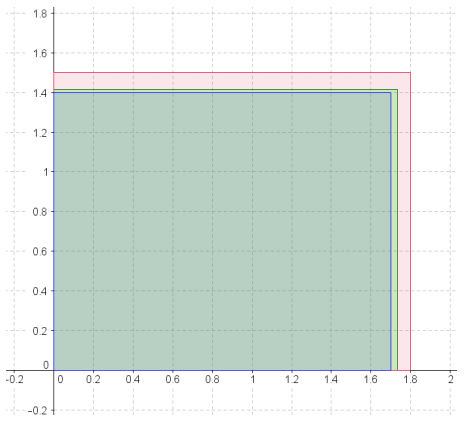
Use Figures 1, 2, and 3 to find upper and lower approximations of the given rectangle.
Figure 1.
Answer:

We can make a more precise estimate of the area, A, by looking at side lengths that are more precise. Since we know how to find the area of rectangles with rational side lengths, let us pick more precise side lengths that are closer in value to √3 × √2; we will select arbitrary, but appropriate, rational values. Let us create an upper approximation of the area, A, by using a rectangle with dimensions 1.8 × 1.5 (shown in red) and a lower approximation by using a rectangle with dimensions 1.7 × 1.4 (shown in blue).
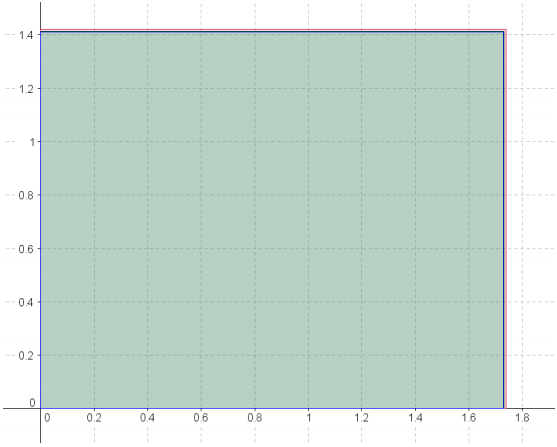
Figure 2.
Answer:
Can we make a more precise approximation? Describe dimensions of a possible lower approximation for A that is more precise than 1.7 × 1.4.
Allow students to share out possible values. Remind them of the values of the dimensions they are targeting and that the goal is to use approximate dimensions that are closer to the true values: √3 = 1.732 050 80 … by √2 = 1.414 213 56. Guide students toward the idea that the way to refine the dimensions is to rely on the digits directly from the decimal values of √3 and √2. For the lower approximation dimensions, the exact digits are selected but truncated from the expansion. With the upper approximation dimensions, for each successive dimension and additional place value, one digit greater than the digit in place of the actual expansion is taken.
The area, A, of the rectangle is greater than the area of a rectangle that is 1.73 × 1.41 (shown in blue) but less than the area of a rectangle that is 1.74 × 1.42 (shown in red).
Figure 3.
Answer:
We can continue to refine the approximations. The area, A (shown in green), of the rectangle is greater than the area of a rectangle that is 1.732 × 1.414 (shown below in blue) but less than the area of a rectangle that is 1.73 3 × 1.4 15 (shown below in red). Notice now that, even as we zoom in, it is difficult to distinguish between the red, black, and blue rectangles because they are so close in size.

Lower Approximations

Answer:
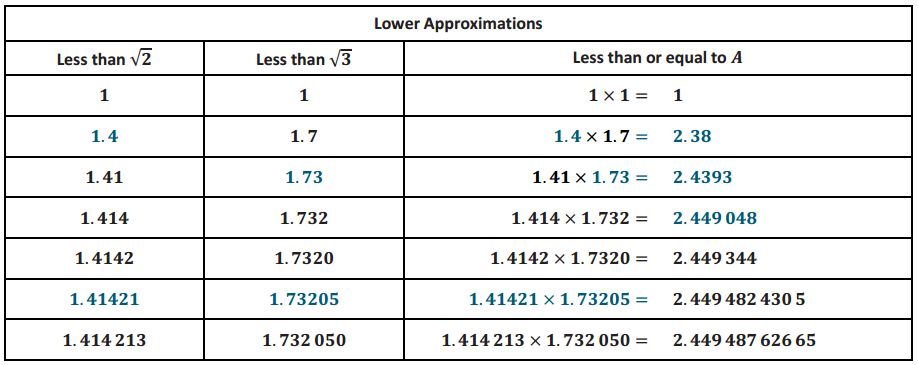
Provide time for students to make sense of the data in the table. Ask the following questions to ensure students understand the data table:
→ What do you notice happening in the first column as you go down the rows?
We are using approximations of √2 that are less than the actual value but becoming closer and closer to the actual value.
→ What do you notice happening in the second column as you go down the rows?
We are using approximations of √3 that are less than the actual value but becoming closer and closer to the actual value.
→ What impact do these approximations have on the area, A, as you go down the rows in the third column?
The more precise of an estimate we use for √2 and √3 the closer we get to the precise area of the rectangle.
→ What do you notice about decimal expansions of the product?
D More and more of the digits in the expansion of the product are the same.
→ Why are all of these calculations less than A? When will it be equal to A?
Students may not have precise answers to these questions. They are prompts to help shape their number sense.
→ Find the decimal value of √6. How do the decimal expansions of the product relate to √6.
They are getting closer to the decimal expansion of √6.
→ What does have to do with and f?
√6 is the product of √2 and √3.
→ In the table above, we underestimate the side lengths so the area estimate is less than the actual area of the rectangle. Similarly, in the table below, we overestimate the side lengths (red rectangles) so our area estimate is greater than the actual area. Again, a few additional values beyond those we discussed have been added.
Upper Approximations

Answer:
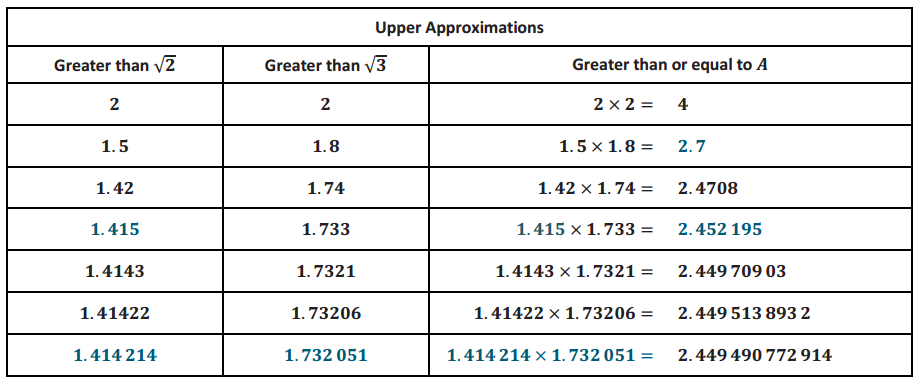
→ Does the relationship with √6 still seem to hold relative to the upper approximation of the area as it did with the lower approximation?
Yes, each successive upper approximation of A is closer and closer to √6.
→ Putting these two tables together we can get two estimates for the area A: One that is less than A, and one
that is greater than A.
→ Recall that if we know that the true value of the area is a number between 2.38 and 2.7, then we know that the absolute value of the error is less than 2.7 – 2.38 and that A > 2.38. Then the upper bound on the error using the numbers 2.38 and 2.7 as an approximation X for A is found by \(\frac{|X-A|}{A}\) < \(\frac{0.32}{2.38}\) ≅ 0.134 453, and the percent error is approximately 13.45%.
→ If we continue the lower and upper estimates for the area A, we would find that there is only one number that is greater than or equal to all of the lower estimates and less than or equal to all of the upper estimates: √6.
→ Thus, we say that the area of the rectangle is √6 because this is the only number that is always between the lower and upper estimates using rectangles with rational side lengths. Using this reasoning, we can say that the area of any rectangle is given by length × width.
Discussion:
If it takes one can of paint to cover a unit square in the coordinate plane, how many cans of paint are needed to paint the region within the curved figure?
Answer:
Provide time for students to discuss the problem with partners or in small groups. Then have students share their strategies with the whole class. If necessary, the bullet points below can be used to guide students’ thinking.
Student strategies will vary. Encourage those strategies that approximate the area of the curved region by making approximations first with whole squares, then with partial squares, and finally comparing the area of regions outside and inside the curve, as close to the actual area as possible.
→ First, since we know how to find the area of a half square region, find how many squares and half squares fit inside the region.

This strategy says that it takes more than 34 cans of paint.
→ Now consider the area of the region just outside the curve. How many cans of paint does it take if we count the squares and half squares?
Point out to students that the shaded area is the minimum area needed to fill the ellipse, composed of whole and half squares, completely.

This strategy says that it takes less than 52 cans of paint.
→ An estimate of the area is the average of 34 and 52, or 43 cans of paint. How can we improve the accuracy of our estimate?
if we use smaller square units, we could make a more accurate estimate of the area.
→ If we divide each unit square into four smaller squares and count all of the squares and half squares, how many cans of paint does it take to cover the region inside the curve?

There are 164 squares and half squares in the region inside the curve. Since it takes 1 can of paint to cover every 4 of these squares, then it takes more than 41 cans of paint to cover this region
→ Now consider the area of the region just outside the curve. How many cans of paint does it take if we count the squares and half squares?

There are 204 squares and half squares covered, so it takes less than 51 cans of paint to cover the region inside the curve.
→ What is a good estimate for the area of the region? Explain how you know.
An estimate of the area is the average of 41 and 51, or about 46 cans of paint.
→ There are ways to determine the precise area of the curved region. We have not learned them yet so I will just tell you that the precise area of the region is 15n 47.12. If the area is known to be 15n, which estimate is
better? How do you know?
→ This is the unique number that is greater than every lower approximation and less than every upper approximation. The first estimate of 43 cans of paint had an error of about 8.75%. The second estimate, 46, had an error of about 2.4%. We could continue to improve the accuracy of our estimate by using even smaller squares in the grid.