Engage NY Eureka Math Algebra 2 Module 4 Lesson 11 Answer Key
Eureka Math Algebra 2 Module 4 Lesson 11 Example Answer Key
Example 1: Calculation of Normal Probabilities Using z-Scores and Tables of Standard Normal Areas
The U.S. Department of Agriculture (USDA), in its Official Food Plans (www.cnDp.usda.ov), states that the average cost of food for a 14- to 18-year-old male (on the Moderate-Cast Plan) is $261. 50 per month. Assume that the monthly food cost for a 14- to 18-year-old male is approximately normally distributed with a mean of $261.50 and a standard deviation of $16. 25.
a. Use a table of standard normal curve areas to find the probability that the monthly food cost for a randomly selected 14- to 18-year-old male is
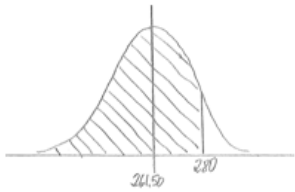
i. Less than $280.
Answer:
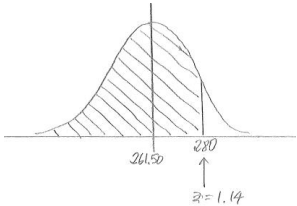
P(less than 280) = 0.8729
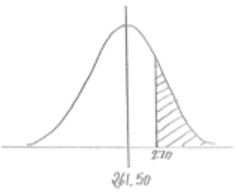
ii. More than $270
Answer:
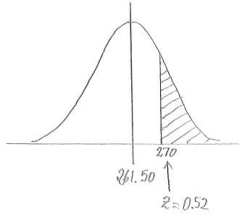
P(greater than 270) = 1 – 0.6985 = 0.3015
iii. More than $250
Answer:
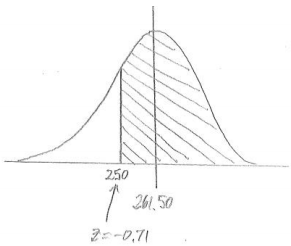
P(greater than 250) = 1 – 0.2389 = 0.7611
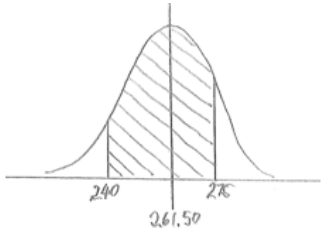
iv. Between $240 and $275
Answer:
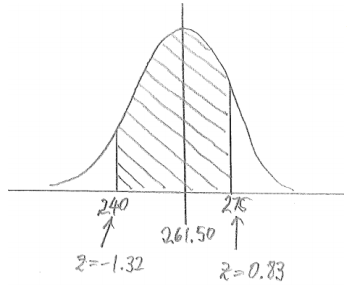
P(between 240 and 275) = 0.7967 – 0.0934 = 0.7033
b. Explain the meaning of the probability that you found in part (a)(iv).
Answer:
If a very large number of 14- to 18-year-old males were to be selected at random, then you would expect about 70.33% of them to have monthly food costs between $240 and $275.
Exercise 1:
The USDA document described in Example 1 also states that the average cost of food for a 14- to 18-year-old female (again, on the Moderate-Cost Plan) is $215.20 per month. Assume that the monthly food cost for a 14- to 18-year-old female is approximately normally distributed with a mean of $215.20 and a standard deviation of $14.85.
a. Use a table of standard normal curve areas to find the probability that the monthly food cost for a randomly selected 14- to 18-year-old female is
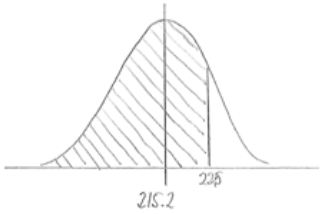
i. Less than $225.
Answer:
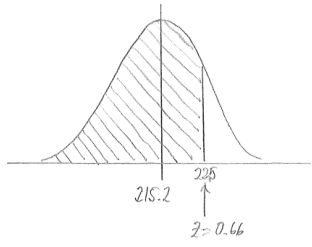
P(less than 225) = 0.7454
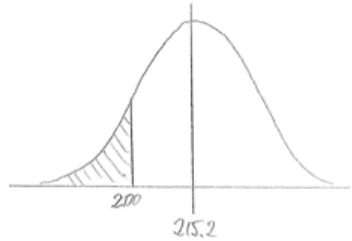
ii. Less than $200.
Answer:
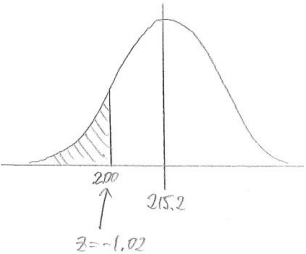
P(less than 200) = 0.1539
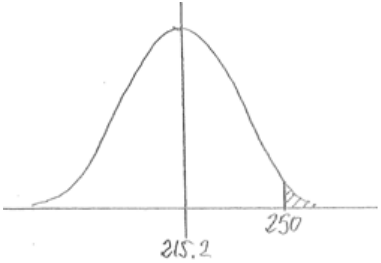
iii. More than $250
Answer:
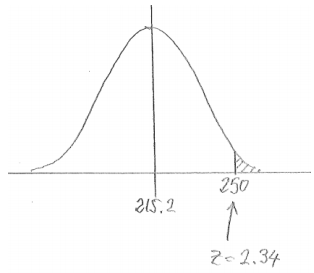
P(more than 250) = 0.0096
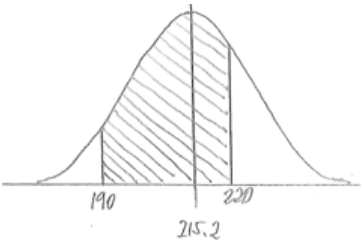
iv. Between $190 and $220
Answer:
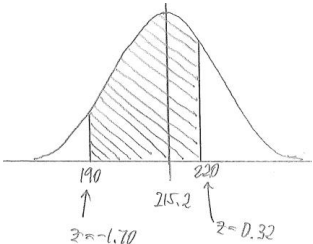
P(between 190 and 220) = 0.6255 – 0.0446 = 0.5809
b. Explain the meaning of the probability that you found In part (a)(iv).
Answer:
If a very large number of 14- to 18-year-old females were to be selected at random, then you would expect about 58.09% of them to have monthly food costs between $190 and $220.
Example 2: Use of a Graphing Calculator to Find Normal Probabilities Directly
Return to the information given in Example 1. Using a graphing calculator, and without using z-scores, find the probability (rounded to the nearest thousandth) that the monthly food cost for a randomly selected 14- to 18-year-old male is
a. Between $260 and $265.
Answer:
P(between $260 and $265) = 0.122
If students are using Ti-83 or Ti-84 calculators, this result is found by entering Normalcdf(260, 265, 261.5, 16.25).
b. At least $252.
Answer:
P(≥ 252) = 0.721
This result is found by entering Normalcdf(252, 999, 261.5, 16.25) or the equivalent for other brands of calculators. Any large positive number or 1EE99 can be used in place of 999, as long as the number is at least four standard deviations above the mean.
c. At most $248.
Answer:
P(≤ 248) = 0.203
This result is found by entering Normalcdf(-999, 248,261.5, 16.25) or the equivalent for other brands of calculators. Any large negative number or -1EE99 can be used in place of -999, as long as the number is at least four standard deviations below the mean.
Exercise 2:
Return to the information given in Exercise 1.
a. In Exercise 1, you calculated the probability that the monthly food cost for a randomly selected 14- to 18-year- the old female is between $190 and $220. Would the probability that the monthly food cost for a randomly selected 14- to 18-year-old female is between $195 and $230 be greater than or smaller than the probability for between $190 and $220? Explain your thinking.
Answer:
The probability would be greater between $195 and $230. If you look at a sketch of a normal curve with mean $215.20 and a standard deviation of $14. 85, there is more area under the curve for the wider interval of $195 to $230.
b. Do you think that the probability that the monthly food cost for a randomly selected 14- to 18-year-old female is between $195 and $230 is closer to 0.50, 0.75, or 0.90? Explain your thinking.
Answer:
Closer to 0.75. Based on my answer to part (a), I expect the probability to be greater than the probability for between $190 and $220, which was 0.5809, but I do not think it would be as great as 0.90.
c. Using a graphing calculator, and without using z-scores, find the probability (rounded to the nearest thousandth) that the monthly food cost for a randomly selected 14- to 18-year-old female is between $195 and $230. Is this probability consistent with your answer to part (b)?
Answer:
P(between 195 and 230) = 0.754
This probability is close to 0.75, which was my answer in part (b).
d. How does the probability you calculated in part (c) compare to the probability that would have been obtained using the table of normal curve areas?
Answer:
The z-score for $195 as z = \(\frac{195-215.20}{14.85}\) = -1.36, and the z-score for $230 is z = \(\frac{230-215.20}{14.85}\) = 1.00.
Using the table of normal curve areas, P(between 195 and 230) = 0.8413 – 0.0853 = 0.756. This Is very close to the answer that I got using the graphing calculator.
e. What is one advantage to using a graphing calculator to calculate this probability?
Answer:
It is a lot faster to use the graphing calculator because I did not have to calculate z-scores in order to get the probability.
f. In Exercise 1, you calculated the probability that the monthly food cost for a randomly selected 14- to 18-year- the old female is at most $200. Would the probability that the monthly food cost for a randomly selected 14- to 18-year-old female is at most $210 be greater than or less than the probability for at most $200? Explain your thinking.
Answer:
The probability would be greater for at most $210. There is more area under the normal curve to the left of $210 than to the left of $200.
g. Do you think that the probability that the monthly food cost for a randomly selected 14- to 18-year-old female is at most $210 is closer to 0.10, 0.30, or 0.50? Explain your thinking.
Answer:
Closer to 0.30. Based on my answer to part (f), I expect the probability to be greater than the probability for at most $200, which was 0. 1539, but I do not think it would be as great as 0.50 because $210 is less than the mean of $215. 20, and the area to the left of $215.20 is 0. 50.
h. Using a graphing calculator, and without using z-scores, find the probability (rounded to the nearest thousandth) that the monthly food cost for a randomly selected 14- to 18-year-old female is at most $210.
Answer:
P(≤ 210) = 0.363
i. Using a graphing calculator, and without using z-scores, find the probability (rounded to the nearest thousandth) that the monthly food cost for a randomly selected 14- to 18-year-old female is at least $235.
Answer:
P(≥ 235) = 0.091
Example 3: Using a Spreadsheet to Find Normal Probabilities
Return to the information given In Example 1. The USDA, In Its Official Food Plans (www.cnpp.usda.gov), states that the average cost of food for a 14- to 18-year-old male (on the Moderate-Cost Plan) is $261. 50 per month. Assume that the monthly food cost for a 14- to 18-year-old male is approximately normally distributed with a mean of $261. 50 and a standard deviation of $16.25. Round your answers to four decimal places.
Use a spreadsheet to find the probability that the monthly food cost for a randomly selected 14- to 18-year-old male is
a. Less than $280.
Answer:
If students are using Excel, this would be found by using = NORMDIST(280, 261.50, 16.25, true). The difference between this answer and the answer using the table of normal curve, areas is due to rounding in calculating the z score needed in order to use the table.
P(less than 280) = 0.8725
b. More than $270
Answer:
P(greater than 270) = 1 – 0.6995 = 0.3005
c. More than $250
Answer:
P(greater than 250) = 1 – 0.2396 = 0.7604
d. Between $240 and $275
Answer:
P(between 240 and 275) = 0.7969 – 0.0929 = 0.7040
Exercise 3:
The USDA document described in Example 1 also states that the average cost of food for a 14- to 18-year-old female (again, on the Moderate-Cost Plan) is $215.20 per month. Assume that the monthly food cost for a 14- to 18-year-old female is approximately normally distributed with a mean of $215. 20 and a standard deviation of $14.85. Round your answers to 4 decimal places.
Use a spreadsheet to find the probability that the monthly food cost for a randomly selected 14- to 18-year-old female is
a. Less than $225.
Answer:
P(less than 225) = 0.7454
b. Less than $200
Answer:
P(less than 200) = 0.1530
c. More than $250
Answer:
P(more than 250) = 1 – 0.9904 = 0.0096
d. Between $190 and $220
Answer:
P(between 190 and 220) = 0.6267 – 0.0449 = 0.5818
Exercise 4:
The reaction times of 490 people were measured. The results are shown in the frequency distribution below.

a. Construct a histogram that displays these results.
Answer:
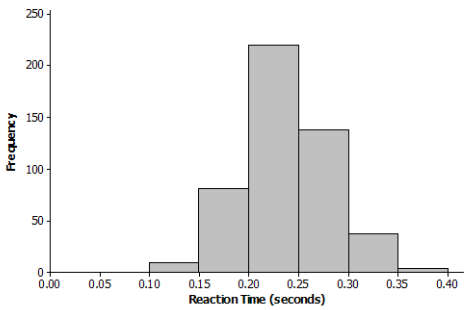
b. Looking at the histogram, do you think a normal distribution would be an appropriate model for this distribution?
Answer:
Yes, the histogram is approximately symmetric and mound-shaped.
c. The mean of the reaction times for these 490 people is 0.2377, and the standard deviation of the reaction times is 0.0457. For a normal distribution with this mean and standard deviation, what is the probability that a randomly selected reaction time is at least 0.25?
Answer:
Using Normalcdf(0.25, 999, 0.2377, 0.0457), you get P(≥ 0.25) = 0.394.
d. The actual proportion of these 490 people who had a reaction time that was at least 0.25 is 0.365 (this can be calculated from the frequency distribution). How does this proportion compare to the probability that you calculated in part (c)? Does this confirm that the normal distribution is an appropriate model for the reaction time distribution?
Answer:
0.365 is reasonably close to the probability based on the normal distribution, which was 0.394. I think that the normal model was appropriate.
Eureka Math Algebra 2 Module 4 Lesson 11 Problem Set Answer Key
Question 1.
Use a table of standard normal curve areas to find the following:
a. The area to the left of z = 1. 88
Answer:
0.9699
b. The area to the right of z = 1.42
Answer:
1 – 0.9222 = 0.0778
c. The area to the left of z = -0.39
Answer:
0.3483
d. The area to the right of z = -0.46
Answer:
1 – 0.3228 = 0.6772
e. The area between z = -1.22 and z = -0.5
Answer:
0.3085 – 0.1112 = 0.1973
Question 2.
Suppose that the duration of high school baseball games is approximately normally distributed with mean of 105 minutes and a standard deviation of 11 minutes. Use a table of standard normal curve areas to find the probability that a randomly selected high school baseball game lasts
a. Less than 115 minutes.
Answer:
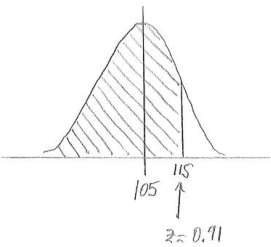
P(less than 115) = 0.8186
b. More than 100 minutes
Answer:
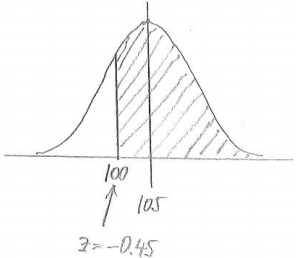
P(greater than 100) = 1 – 0.3264 = 0.6736
c. Between 90 and 110 minutes
Answer:
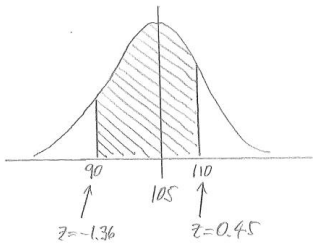
P(between 90 and 110) = 0.6736 – 0.0869 = 0.5867
Question 3.
Using a graphing calculator, and without using z-scores, check your answers to Problem 2. (Round your answers to the nearest thousandth.)
Answer:
a. P(less than 115) = 0.818
b. P(greater than 100) = 0.675
c. P(between 90 and 110) = 0.589
Question 4.
In Problem 2, you were told that the duration of high school baseball games is approximately normally distributed with a mean of 105 minutes and a standard deviation of 11 minutes. Suppose also that the duration of high school softball games is approximately normally distributed with a mean of 95 minutes and the same standard deviation, 11 minutes.
Is it more likely that a high school baseball game will last between 100 and 110 minutes or that a high school softball game will last between 100 and 110 minutes? Answer this question without doing any calculations.
Answer:
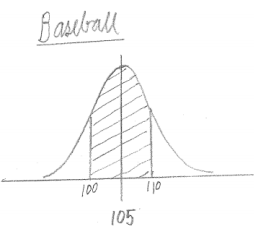
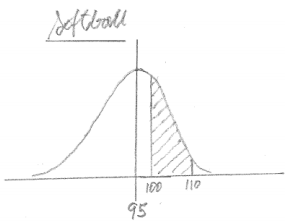
The heights of the two normal distribution graphs are the same; the only difference between the graphs is that the softball graph has a smaller mean. So, when the region under the graph between 100 and 110 is shaded, you get a larger area for the baseball graph than for the softball graph. Therefore, it is more likely that the baseball game will last between 100 and 110 minutes.
Question 5.
A farmer has 625 female adult sheep. The sheep have recently been weighed, and the results are shown in the table below.
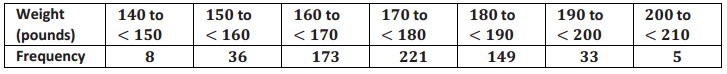
a. Construct a histogram that displays these results.
Answer:
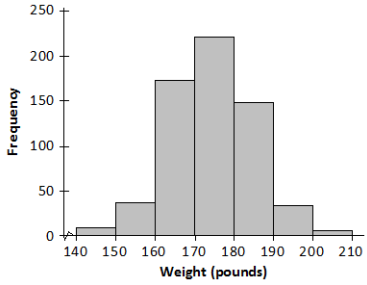
b. Looking at the histogram, do you think a normal distribution would be an appropriate model for this distribution?
Answer:
Yes, the histogram is approximately symmetric and mound-shaped.
c. The weights of the 625 sheep have mean of 174.21 pounds and a standard deviation 10.11 pounds. For a normal distribution with this mean and standard deviation, what is the probability that a randomly selected sheep has a weight of at least 190 pounds? (Round your answer to the nearest thousandth.)
Answer:
Using Normalcdf(190, 999, 174.21, 10.11), you get P(greater than 190) = 0.059.
Eureka Math Algebra 2 Module 4 Lesson 11 Exit Ticket Answer Key
Question 1.
SAT scores were originally scaled so that the scores for each section were approximately normally distributed with a mean of 500 and a standard deviation of 100. Assuming that this scaling still applies, use a table of standard normal curve areas to find the probability that a randomly selected SAT student scores
a. More than 700.
Answer:
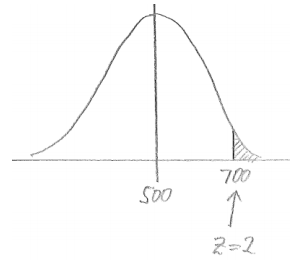
P(greater than 700) = 1 – 0.9772 = 0.0228
b. Between 440 and 560.
Answer:
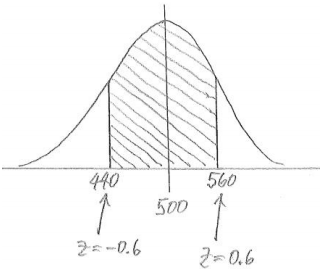
P(between 440 and 560) = 0.7257 – 0.2743 = 0.4514
Question 2.
In 2012, the mean SAT math score was 514, and the standard deviation was 117. For the purposes of this question, assume that the scores were normally distributed. Using a graphing calculator, and without using z-scores, find the probability (rounded to the nearest thousandth), and explain how the answer was determined that a randomly selected SAT math student in 2012 scored.
a. Between 400 and 480.
Answer:
P(between 400 and 480) = 0.221
I used a TI-84 graphing calculator: Normalcdf (400, 480, 514, 117).
b. Less than 350.
Answer:
P(less than 350) = 0.081
I used a Ti-84 graphing calculator: Normalcdf(0, 350, 514, 117).