Engage NY Eureka Math Algebra 2 Module 4 Lesson 10 Answer Key
Eureka Math Algebra 2 Module 4 Lesson 10 Exercise Answer Key
Exercise 1:
Consider the following data distributions. In the previous lesson, you distinguished between distributions that were approximately normal and those that were not. For each of the following distributions, indicate if it is approximately normal, skewed, or neither, and explain your choice:
a. 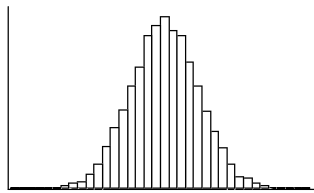
Answer:
This distribution is approximately normal. It is approximately symmetric and mound-shaped.
b. 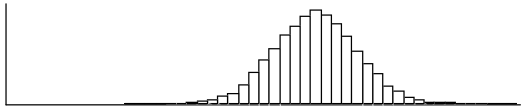
Answer:
This distribution is approximately normal. It is approximately symmetric and mound-shaped.
c. 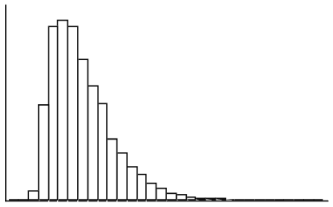
Answer:
This distribution is not symmetric; therefore, it is not approximately normal. This distribution is skewed to the right as it has most of the data values in the beginning and then tapers off. It has a longer tail on the right.
d. 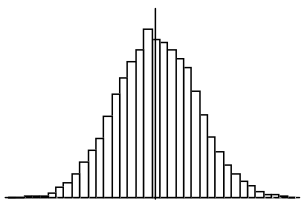
Answer:
This distribution is approximately normal. It is symmetric and mound-shaped.
e. 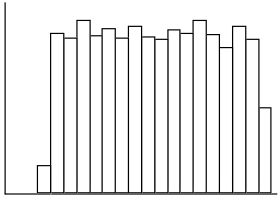
Answer:
This distribution is not approximately normal. It is symmetric but not mound-shaped. This distribution, however, is also not skewed. It does not have a longer tail on one side. It would be described as approximately a uniform distribution.
Note that this distribution was discussed in earlier grades. It is important to emphasize that there are other types of data distributions and that not all are either approximately normal or skewed.
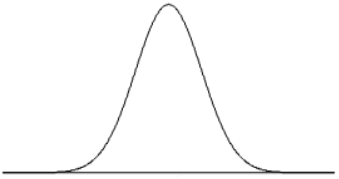
A normal distribution is a distribution that has a particular symmetric mound shape, as shown below.
Exercise 2:
When calculating probabilities associated with normal distributions, z-scores are used. A z-score for a particular value measures the number of standard deviations away from the mean. A positive z-score corresponds to a value that is above the mean, and a negative z-score corresponds to a value that is below the mean.
The letter z is used to represent a variable that has a standard normal distribution where the mean is 0 and standard deviation is 1. This distribution was used to define a z-score. A z-score is calculated by value – mean standard deviation.
z = \(\frac{\text { value }-\text { mean }}{\text { standard deviation }}\)
a. The prices of the printers in a store have a mean of $240 and a standard deviation of $50. The printer that you eventually choose costs $340.
i. What is the z-score for the price of your printer?
Answer:
z = \(\frac{340-240}{50}\) = 2
ii. How many standard deviations above the mean was the price of your printer?
Answer:
The price of my printer was 2 standard deviations above the mean price.
b. Ashish’s height is 63 inches. The mean height for boys at his school is 68.1 inches and the standard deviation of the boys’ heights is 2.8 inches.
i. What is the z-score for Ashish’s height? (Round your answer to the nearest hundredth.)
Ans?:
z = \(\frac{63-68.1}{2.8}\) ≈ -1.82
ii. What is the meaning of this value?
Answer:
Ashish’s height is 1.82 standard deviations below the mean height for boys at his school.
c. Explain how a z-score is useful in describing data.
Answer:
A z-score is useful in describing how far a particular point is from the mean.
Exercise 3:
The distribution of lifetimes of a particular brand of car tires has a mean of 51,200 miles and a standard deviation of 8,200 miles.
a. Assuming that the distribution of lifetimes is approximately normally distributed and rounding your answers to the nearest thousandth, find the probability of each event.
i. A randomly selected tire lasts between 55,000 and 65,000 miles.
Answer:
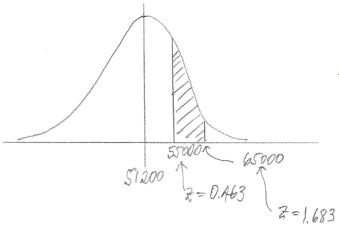
P(between 55000 and 65000) = 0.275
ii. A randomly selected tire lasts less than 48,000 miles
Answer:
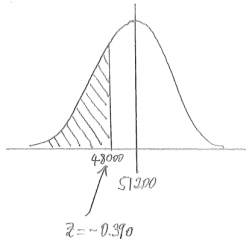
P(less than 48000) = 0.348
iii. A randomly selected tire lasts at least 41,000 miles.
Answer:
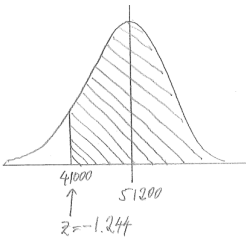
P(grreater than 41,000) = 0.893
b. Explain the meaning of the probability that you found in part (a)(iii).
Answer:
If a large number of tires of this brand were to be randomly selected, then you would expect about 89. 3% of them to last more than 41,000 miles.
Exercise 4:
Think again about the brand of tires described in Exercise 3. What is the probability that the lifetime of a randomly selected tire is within 10,000 miles of the mean lifetime for tires of this brand?
Answer:
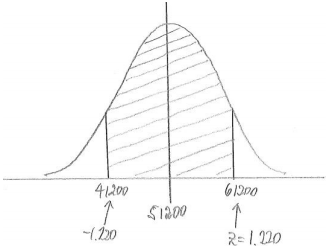
P(within 10000 of mean) = 0.778
Eureka Math Algebra 2 Module 4 Lesson 10 Example Answer Key
Example 1: Use of z-Scores and a Graphing Calculator to Find Normal Probabilities
A swimmer named Amy specializes in the 50-meter backstroke. In competition, her meantime for the event is 39.7 seconds, and the standard deviation of her times Is 2.3 seconds. Assume that Amy’s times are approximately normally distributed.
a. Estimate the probability that Amy’s time is between 37 and 44 seconds.
Answer:
The first time is a little less than 2 standard deviations from her mean time of 39.7 seconds. The second time is nearly 2 standard deviations above her meantime. As a result, the probability of a time between the two values covers nearly 4 standard deviations and would be rather large. I estimate 0.9, or 90%.
b. Using z-scores and a graphing calculator and rounding your answers to the nearest thousandth, find the probability that Amy’s time in her next race is between 37 and 44 seconds.
Answer:
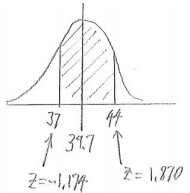
The z-score for 44 is z = \(\frac{44-39.7}{2.3}\) ≈ 1.870 and the z-score for 37 is
z = \(\frac{37-39.7}{2.3}\) ≈ -1.174.
The probability that Amy’s time is between 37 and 44 seconds is then found to be 0. 849.
Note: If students are using Ti – 83 or Ti – 84 calculators, this result is found by entering Normalcdf(-1.174, 1.870).
c. Estimate the probability that Amy’s time is more than 45 seconds.
Answer:
Amy’s time of 45 seconds is more than 2 standard deviations from the mean of 39.7 seconds. There is a small probability that her time will be greater than 45 seconds. I estimate 0.03, or 3%.
d. Using z-scores and a graphing calculator and rounding your answers to the nearest thousandth, find the probability that Amy’s time in her next race is more than 45 seconds.
Answer:
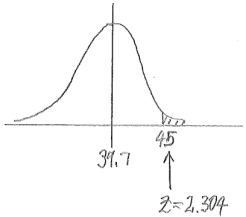
The z-score for 45 is z = \(\frac{45-39.7}{2.3}\) ≈ 2.304.
The probability that Amy’s time is more than 45 seconds is then found to be 0.011.
Note: This result is found by entering Normalcdf(2.304, 999) or the equivalent of this for other brands of calculators. The keystroke for positive infinity on some calculators is 1EE99. The number 999 can be replaced by any large positive number.
Strictly speaking, the aim here is to find the area under the normal curve between z = 2. 304 and positive infinity. However, it is impossible to enter positive infinity into the calculator, so any large positive number can be used in its place.
e. What is the probability that Amy’s time would be at least 45 seconds?
Answer:
Since Amy’s times have a continuous distribution, the probability of “more than 45 seconds” and the probability of “at least 45 seconds” are the same. So, the answer is the same as part (d), 0.011. It is worth pointing out to students that this applies to any question about the normal distribution.
f. Using z-scores and a graphing calculator and rounding your answers to the nearest thousandth, find the probability that Amy’s time in her next race is less than 36 seconds.
Answer:
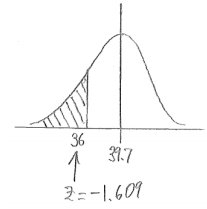
The z-score for 36 is z = \(\frac{36-39.7}{2.3}\) ≈ -1.609.
The probability that Amy’s time is less than 36 seconds is then found to be 0.054.
Note: This result is found by entering Normalcdf(-999, -1.609) or the equivalent of this command for other brands of calculators. Here, -999 is being used in place of negative infinity; any large negative number can be used in its place. The keystroke on some calculators for negative infinity is -1EE99.
Example 2: Using Table of Standard Normal Curve Areas
The standard normal distribution is the normal distribution with a mean of 0 and a standard deviation of 1. The diagrams below show standard normal distribution curves. Use a table of standard normal curve areas to determine the shaded areas.
a. 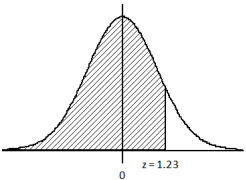
Answer:
The provided table of normal areas gives the area to the left of the selected z-score. So, here, you find 1. 2 in the column on the very left of the table, and then move horizontally to the column labeled 0.03. The table gives the required area (probability) to be 0.8907.
b. 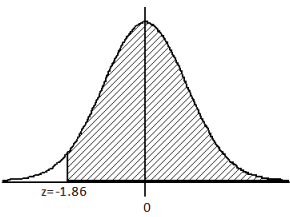
Answer:
In the left-hand column of the table, find -1.8, and move horizontally to the column labeled 0.06. The table gives a probability of 0.0314. Note that the table always supplies the area to the left of the chosen z-score. Also, note that the total area under any normal curve is 1. (This is the case for any probability distribution curve.) So, the required area, which is the area to the right of -1.86, is 1 – 0.0314 = 0. 9686.
c. 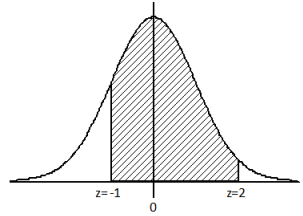
Answer:
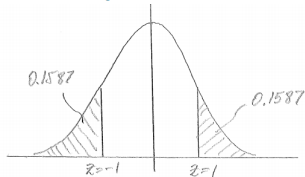
The approach here is to find the area to the left of z = 2 and to subtract the area to the left of z = -1. The table gives the area to the left of z = 2.00 to be 0.9772 and the area to the left of z = -1.0o to be 0.1587. So, the required area is 0.9772 – 0. 1587 = 0.8185.
Eureka Math Algebra 2 Module 4 Lesson 10 Problem Set Answer Key
Question 1.
Which of the following histograms show distributions that are approximately normal?
a. 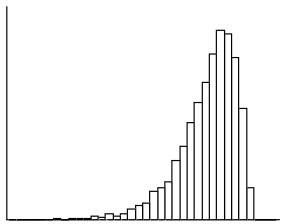
Answer:
No, this distribution is not approximately normal.
b. 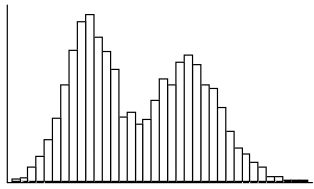
Answer:
No, this distribution is not approximately normal.
c. 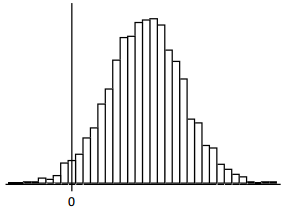
Answer:
Yes, this distribution is approximately normal.
Question 2.
Suppose that a particular medical procedure has a cost that is approximately normally distributed with a mean of $19, 800 and a standard deviation of $2, 900. For a randomly selected patient, find the probabilities of the following events. (Round your answers to the nearest thousandth.)
a. The procedure costs between $18.000 and $22.000.
Answer:
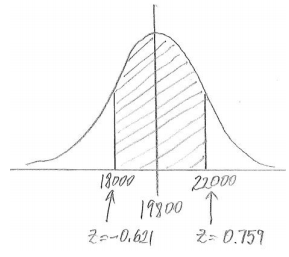
P(between 18000 and 22000) = 0.509
b. The procedure costs less than $15,000.
Answer:
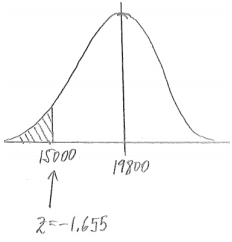
P(less than 15000) = 0.049
c. The procedure costs more than $17,250.
Answer:
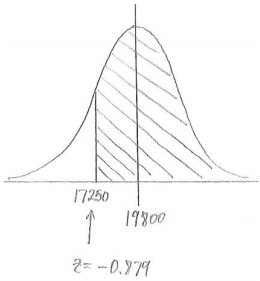
P(greater than 17,250) = 0.810.
Question 3.
Consider the medical procedure described in the previous question, and suppose a patient is charged $24, 900 for the procedure. The patient is reported as saying, “I’ve been charged an outrageous amount!” How justified is this comment? Use probability to support your answer.
Answer:
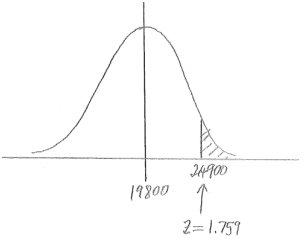
The probability that the procedure will cost at least $24, 900 is 0.039. So, this charge places the patient’s bill in the top 4% of bills for this procedure. While the procedure turned out to be very expensive for this patient, use of the word “outrageous” could be considered a little extreme.
Question 4.
Think again about the medical procedure described in Problem 2.
a. Rounding your answers to the nearest thousandth, find the probability of each instance for a randomly selected patient.
i. The cost of the procedure is within two standard deviations of the mean cost.
Answer:
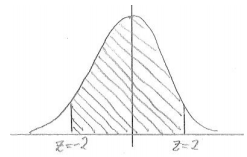
The cost two standard deviations above the mean gives z = 2, and the price two standard deviations below the mean gives z = -2.
The probability that the price is within 2 standard deviations of the mean is 0.954.
ii. The cost of the procedure is more than one standard deviation from the mean cost.
Answer:
The cost one standard deviation above the mean gives z = 1, and the cost one standard deviation below the mean gives z = -1.
2(0.1587) = 0.317
The probability that the cost of the procedure is more than one standard deviation from the mean is 0.317.
b. If the mean or the standard deviation were to be changed, would your answers to part (a) be affected? Explain.
Answer:
No. For example, looking at part (a)(i), the value two standard deviations above the mean will always have a z-score of 2, and the value two standard deviations below the mean will always have a z-score of -2. So, the answer will always be the same whatever the mean and the standard deviation.
Similarly, in part (a)(ii), the z-scores will always be 1 and -1; therefore, the answer will always be the same, regardless of the mean and the standard deviation.
Question 5.
Use a table of standard normal curve areas to find the following:
a. The area to the left of z = 0.56
Answer:
0.7123
b. The area to the right of z = 1,20
Answer:
1 – 0.8849 = 0.1151
c. The areatothe Ieftofz= -1.47
Answer:
0.0708
d. Theareatotherightofz = -0.35
Answer:
1 – 0.3632 = 0.6368
e. The area between z = 1.39 and z = 0.80
Answer:
0.7881 – 0.0823 = 0.7058
f. choose a response from parts (a) through (f), and explain how you determined your answer.
Answer:
Answers will vary.
Sample response: To find the area to the right of z = -0.35 in part (d), I used the table to find the cumulative area up to (which is to the left of) z = -0.35. Then, to find the area to the right of the z-score, I had to subtract the cumulative area from 1.
Eureka Math Algebra 2 Module 4 Lesson 10 Exit Ticket Answer Key
Question 1.
The weights of cars passing over a bridge have a mean of 3,550 pounds and standard deviation of 870 pounds. Assume that the weights of the cars passing over the bridge are normally distributed. Determine the probability of each instance, and explain how you found each answer.
a. The weight of a randomly selected car is more than 4,000 pounds.
Answer:
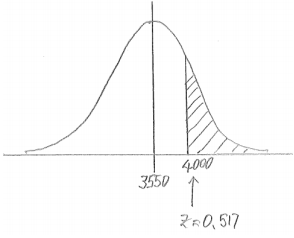
P(greater than 4000) = 0.303
I calculated a z-score and then used my graphing calculator to find the area under the normal curve (above z = 0.517).
b. The weight of a randomly selected car is less than 3,000 pounds.
Answer:
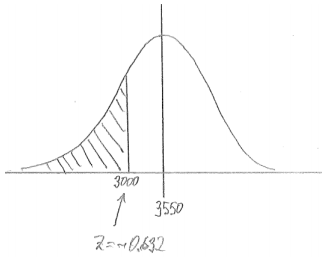
P(less than 3000) = 0.264
I calculated a z-score and then used my graphing calculator to find the area under the normal curve (below z = -0.632).
c. The weight of a randomly selected car is between 2,800 and 4,500 pounds.
Answer:
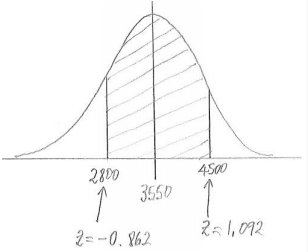
P(between 2800 and 4500) = 0.668
I calculated two z-scores and then used my graphing calculator to find the area under the normal curve (between z = -0.862 and z = 1.092).