Engage NY Eureka Math Algebra 2 Module 2 Lesson 13 Answer Key
Eureka Math Algebra 2 Module 2 Lesson 13 Example Answer Key
Example 1.
Write a Sinusoidal Function to Model a Set of Data
a. On the scatter plot you created in the Opening Exercise, sketch the graph of a sinusoidal function that could be used to model the data.
Answer:
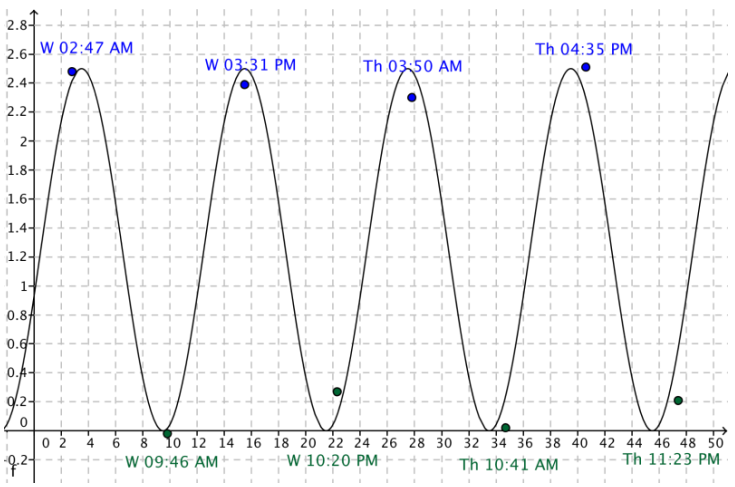
b. What are the midline, amplitude, and period of the graph?
Answer:
Answers will vary depending on student graphs but should be close to those listed below.
Midline: y = 1.25
Amplitude: 1.25
Period: 12
c. Estimate the horizontal distance between a point on the graph that crosses the midline and the vertical axis.
Answer:
The distance is about 12.5 hours.
d. Write a function of the form f(x) = A sin(ω(x – h)) + k to model these data, where x is the hours since midnight on May 21, and f(x) is the height in feet relative to the MLLW.
Answer:
f(x) = 1.25 sin (\(\frac{2 \pi}{12}\)(x – 12.5)) + 1.25.
Example 2. Digital Sampling of Sound
When sound is recorded or transmitted electronically, the continuous waveform is sampled to convert it to a discrete digital sequence. If the sampling rate (represented by the horizontal scaling) or the resolution (represented by the vertical scaling) increases, the sound quality of the recording or transmission improves.
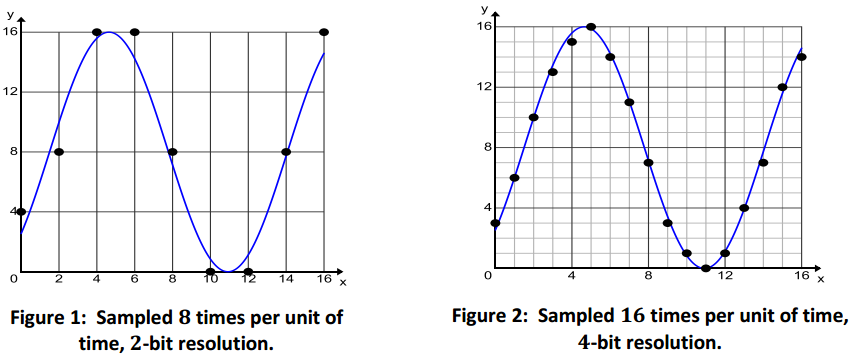
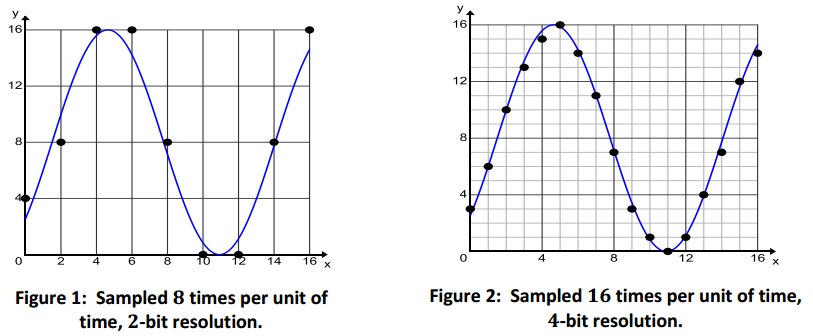
The data graphed below represent two different samples of a pure tone. One is sampled 8 times per unit of time at a 2-bit resolution (4 equal intervals in the vertical direction), and the other is sampled 16 times per unit of time at a 4-bit resolution (8 equal intervals in the vertical direction).
a. Which sample points would produce a better model of the actual sound wave? Explain your reasoning.
Answer:
You will get a better model with the sample points in Figure 2. If the function we use to model the data passes through more data points on the original sound wave, the curve we use to fit the data will accurately represent the original sound.
b. Find an equation for a function g that models the pure tone sampled in Figure 1.
Answer:
g(x) = 8.6436 sin(0. 5089x – 0. 8891) + 8.3651
c. Find an equation for a function h that models the pure tone sampled in Figure 2.
Answer:
h(x) = 7.8464 sin(0. 4981x – 0.7327) + 7.8760
Eureka Math Algebra 2 Module 2 Lesson 13 Opening Exercise Answer Key
Anyone who works on or around the ocean needs to have information about the changing tides to conduct their business safely and effectively. People who go to the beach or out onto the ocean for recreational purposes also need information about tides when planning their trip. The table below shows tide data for Montauk, NY, for May 21-22, 2014. The heights reported in the table are relative to the Mean Lower Low Water (M 11W). The MLLW is the average height of the lowest tide recorded at a tide station each day during the recording period. This reference point is used by the National Oceanic and Atmospheric Administration (NOAA) for the purposes of reporting tidal data throughout the United States. Each different tide station throughout the United States has its own MLLW. High and low tide levels are reported relative to this number. Since it is an average, some low tide values can be negative. NOAA resets the MLLW values approximately every 20 years.
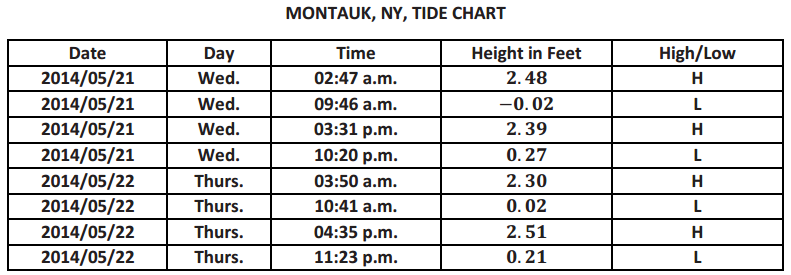
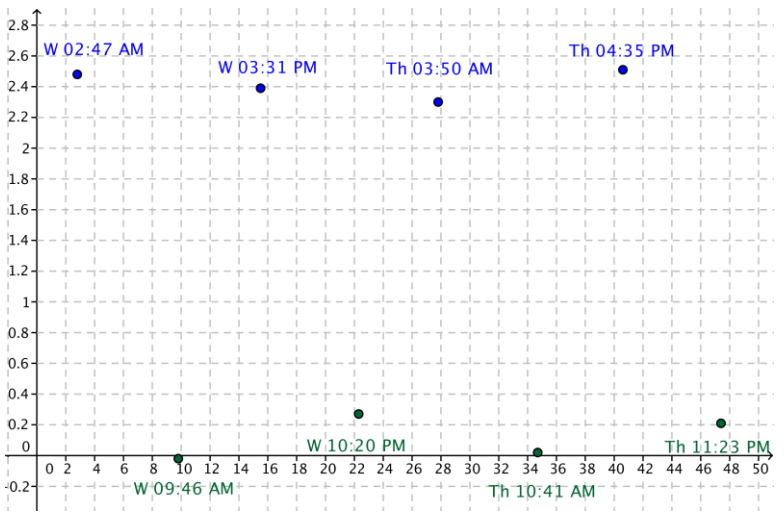
a. Create a scatter plot of the data with the horizontal axis representing time since midnight on May 21 and the vertical axis representing the height in feet relative to the MLLW.
Answer:
b. What type of function would best model this set of data? Explain your choice.
Answer:
Even though the maximum points do not all have the same value, a sinusoidal function would best model this data because the data repeat the pattern of high point, low point, high point, low point, over fairly regular intervals of time-roughly every 6 hours.
Eureka Math Algebra 2 Module 2 Lesson 13 Exercise Answer Key
Exercise 1.
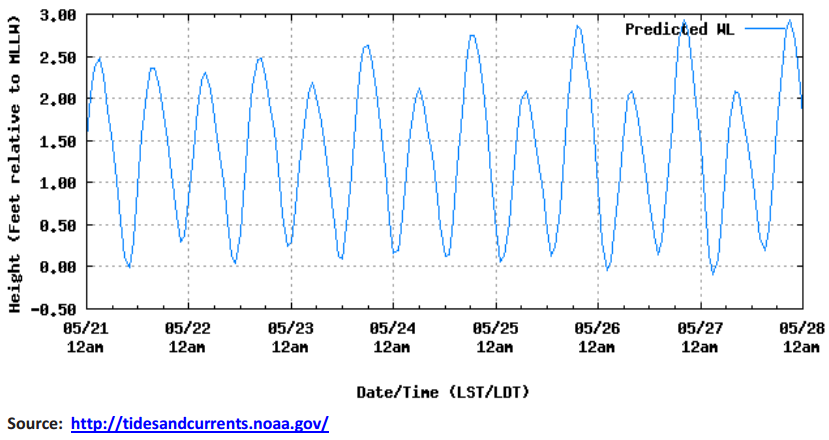
The graph of the tides at Montauk for the week of May 21 – 28 Is shown below. How accurately does your model predict the time and height of the high tide on May 28?
Answer:
The maximum value of f is 2.5. The high tide on May 28 was almost 3 feet above MLLW. The model is off by approximately 6 inches.
Example 2: Digital Sampling of Sound When sound Is recorded or transmitted electronically, the continuous waveform Is sampled to convert it to a discrete digital sequence. If the sampling rate (represented by the horizontal scaling) or the resolution (represented by the vertical scaling) Increases, the sound quality of the recording or transmission improves.
The data graphed below represent two different samples of a pure tone. One is sampled 8 times per unit of time at a 2-bit resolution (4 equal intervals in the vertical direction), and the other is sampled 16 times per unit of time at a 4-bit resolution (8 equal intervals in the vertical direction).
a. Which sample points would produce a better model of the actual sound wave? Explain your reasoning.
Answer:
You will get a better model with the sample points in Figure 2. If the function we use to model the data passes through more data points on the original sound wave, the curve we use to fit the data will accurately represent the original sound.
b. Find an equation for a function g that models the pure tone sampled in Figure 1.
Answer:
g(x) = 8.6436 sin(0. 5089x – 0.8891) + 8.3651
c. Find an equation for a function h that models the pure tone sampled in Figure 2.
Answer:
h(x) = 7.8464 sin(0. 4981x – 0.7327) + 7.8760
Exercise 2 – 6
Stock prices have historically increased over time, but they also vary in a cyclical fashion. Create a scatter plot of the data for the monthly stock price for a 15-month time period since January 1, 2003.
| Months Since Jan. 1, 2003 | Price at close in dollars |
| 0 | 20.24 |
| 1 | 19.42 |
| 2 | 18.25 |
| 3 | 19.13 |
| 4 | 19.20 |
| 5 | 20.91 |
| 6 | 20.86 |
| 7 | 20.04 |
| 8 | 20.30 |
| 9 | 20.54 |
| 10 | 21.94 |
| 11 | 21.87 |
| 12 | 21.51 |
| 13 | 20.65 |
| 14 | 19.84 |
Exercise 2.
Would a sinusoidal function be an appropriate model for these data? Explain your reasoning.
Answer:
A sinusoidal function would not be appropriate because the data are trending upward as time passes.
We can model the slight upward trend In these data with the linear function f(x) = 19. 5 + 0.13x.
If we add a sinusoidal function to this linear function, we can model these data with an algebraic function that displays an upward trend but also varies in a cyclical fashion.
Exercise 3.
Find a sinusoidal function, g, that when added to the linear function, f, models these data.
Answer:
g(x) = 1. 1 sin (\(\frac{2 \pi}{5.5}\)(x – 4)) (Student answers may vary.)
Exercise 4.
Let S be the stock price function that Is the sum of the linear function listed above and the sinusoidal function in Exercise 3.
Answer:
S(x) = 19.5 + 0.13x + 1.1 sin (\(\frac{2 \pi}{5.5}\)(x – 4))
Exercise 5.
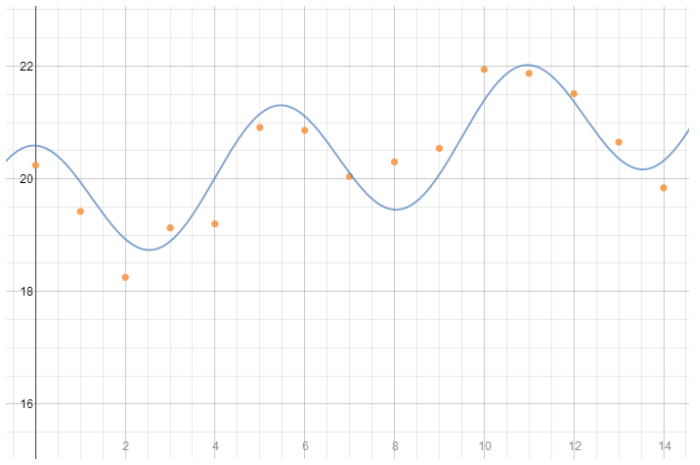
Add the graph of this function to your scatter plot. How well does it appear to fit the data?
Answer:
The scatter plot with the function S is shown below for the first 15 months. In general, it appears to model these data, but there are a few outliers such as the stock value two months after data were reported.
Exercise 6.
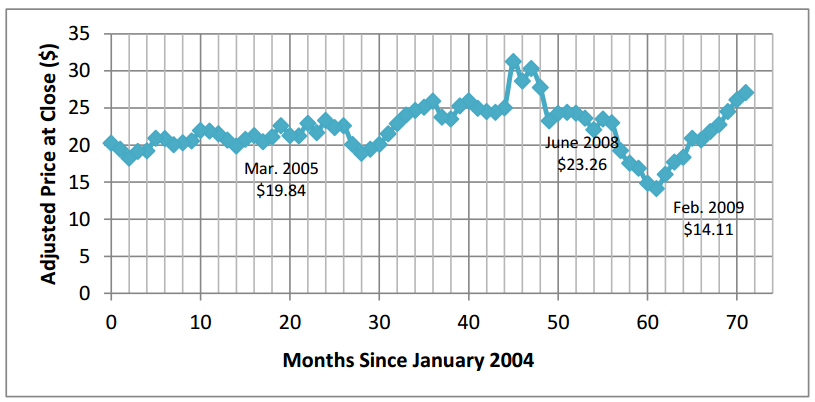
Here is a graph of the same stock through December 2009.
a. Will your model do a good job of predicting stock values past the year 2005?
Answer:
It will not do a very good job of predicting the value of the stock because it rises sharply and then plummets before starting to rise in price after a low in 2009.
b. What event occurred in 2008 to account for the sharp decline in the value of stocks?
Answer:
There was a financial crisis In the stock markets that marked the start of a recession.
c. What are the limitations of using any function to make predictions regarding the value of a stock at some point in the future?
Answer:
There are many variables that can affect the price of a stock. A function that is based only on time will be limited in its ability to predict future events during unforeseen circumstances.
Eureka Math Algebra 2 Module 2 Lesson 13 Problem Set Answer Key
Question 1.
Find equations of both a sine function and a cosine function that could each represent the graph given below.
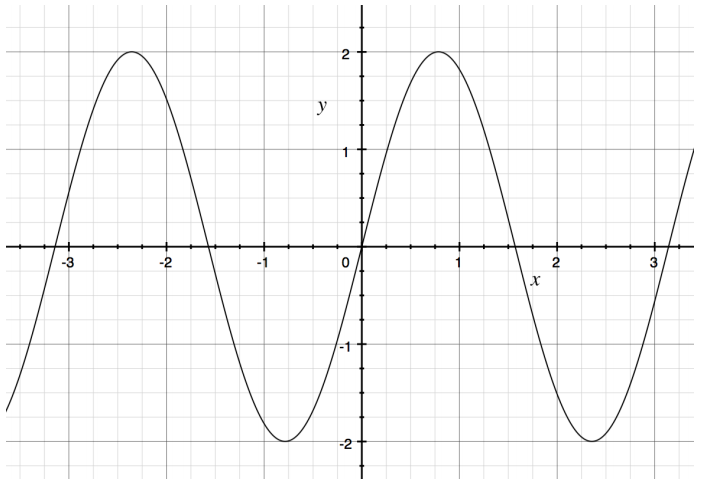
Answer:
y = 2 sin(2x)
y = 2 cos(2 (x + π))
Question 2.
Find equations of both a sine function and a cosine function that could each represent the graph given below.
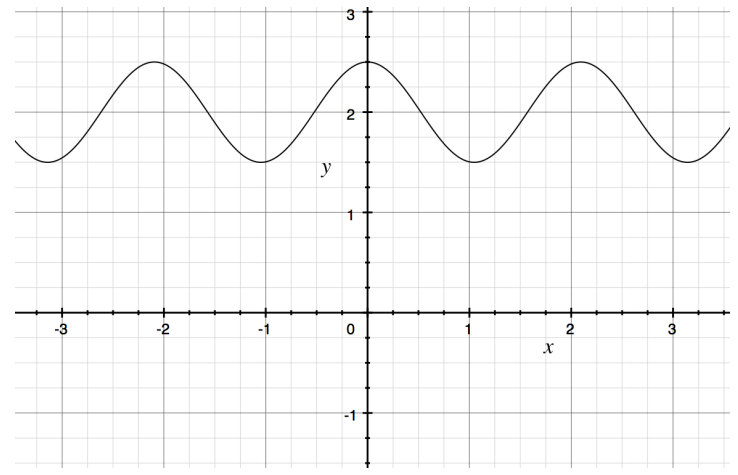
Answer:
y = 0.5 cos(3x) + 2
y = 0.5 sin(3 (x – \(\frac{\pi}{2}\))) + 2
Question 3.
Rapidly vibrating objects send pressure waves through the air that are detected by our ears and then interpreted by our brains as sound. Our brains analyze the amplitude and frequency of these pressure waves.
A speaker usually consists of a paper cone attached to an electromagnet. By sending an oscillating electric current through the electromagnet, the paper cone can be made to vibrate. By adjusting the current, the amplitude and frequency of vibrations can be controlled.
The following graph shows the pressure intensity (I) as a function of time (x), In seconds, of the pressure waves emitted by a speaker set to produce a single pure tone.
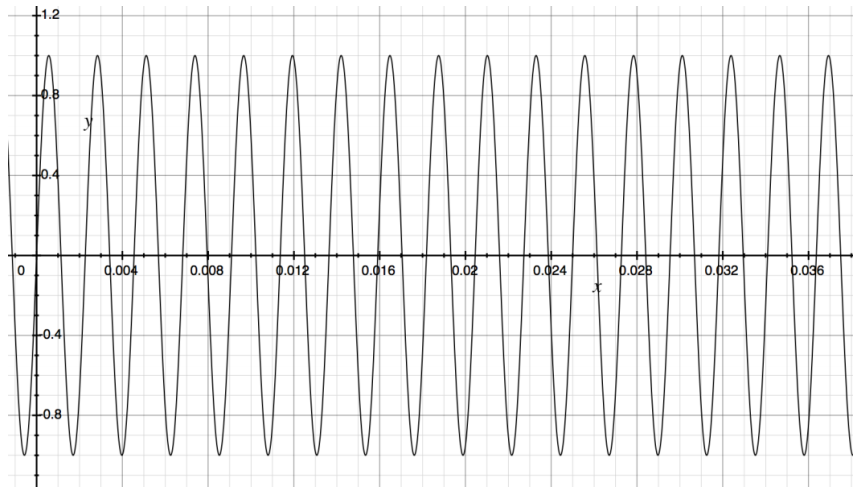
a. Does It seem more natural to use a sine or a cosine function to fit to this graph?
Answer:
Either a sine or a cosine function could be used, but since the graph passes through the origin, It is natural to use a sine function.
b. Find the equation of a trigonometric function that fits this graph.
Answer:
Reading from the graph, we have A = 1, h = 0, k = 0, and 2p 0.0045 (because the graph has an x-Intercept at approximately 0. 0045 after two full periods). Then, p ≈ 0.00225, so ω = \(\frac{2 \pi}{p}\) gives w ≈ 800π. Thus, an equation that models the graph presented here is 1(x) = sin(800πx).
Question 4.
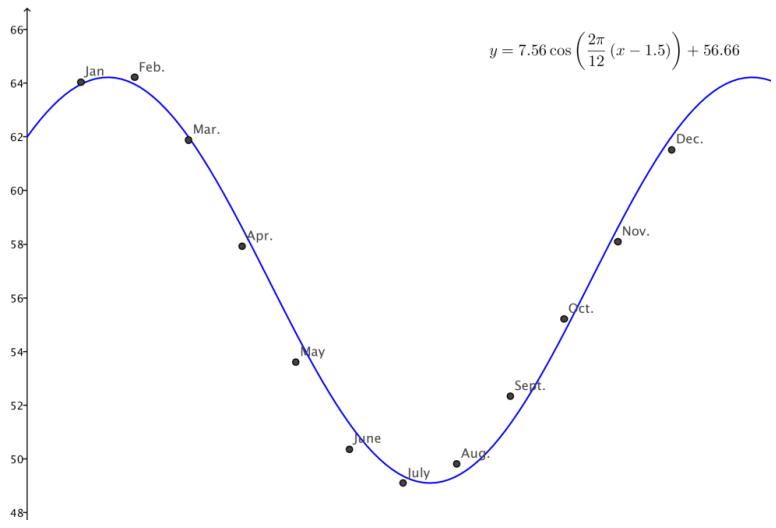
Suppose that the following table represents the average monthly ambient air temperature, in degrees Fahrenheit, in some subterranean caverns in southeast Australia for each of the twelve months in a year. We wish to model these data with a trigonometric function. (Notice that the seasons are reversed in the Southern Hemisphere, so January is in summer, and July is in winter.)
a. Does it seem reasonable to assume that these data, if extended beyond one year, should be roughly periodic?
Answer:
Yes
b. What seems to be the amplitude of the data?
Answer:
There are a number of ways to approximate the amplitude. We can simply take half of the difference of the highest and lowest temperatures, or we can take half of the difference of the highest temperature and the one six months later (or half of the difference of the lowest temperature and the one that is six months earlier). The highest temperature is 64. 22°F; the lowest temperature is 49.82°F. Using these temperatures, we approximate the amplitude to be \(\frac{64.22^{\circ} \mathrm{F}-49.10^{\circ} \mathrm{F}}{2}\) = 7. 56°F.
c. What seems to be the midline of the data (equation of the line through the middle of the graph)?
Answer:
The average of 64. 22°F and 49.10°F six months later is 56.66. Thus, the midline would bey = 56.66; so,
we have k = 56.66.
d. Would it be easier to use sine or cosine to model these data?
Answer:
Cosine would be easier because we can pinpoint a peak of the function more easily than where it should cross the midline.
e. What is a reasonable approximation for the horizontal shift?
Answer:
It appears that the peak of the function would be between January and February, so let’s use h = 1.5 for the horizontal shift. (This assumes that we have labeled January as month 1 and February as month 2.)
f. Write an equation for a function that could fit these data.
Answer:
F(x) = 7.56 cos(\(\frac{2 \pi}{12}\)(x – 1.5)) + 56.66
Question 5.
The table below provides data for the number of daylight hours as a function of day of the year, where day 1 represents January 1. Graph the data and determine if they could be represented by a sinusoidal function. If they can, determine the period, amplitude, and midline of the function, and find an equation for a function that models the data.

Answer:
The data appear sinusoidal, and the easiest function to model them with ¡s a cosine function. The period would be 365 days, so the frequency would be ω = \(\frac{2 \pi}{365}\) ≈ 0.017. The amplitude is \(\frac{1}{2}\)(20. 5 – 3. 6) = 8.45, and the midline is y = k, where k = \(\frac{1}{2}\)(20.5 + 3.6) = 12.05. We want the highest value at the peak, so the horizontal shift is 175.
H = 8.5 cos(0. 017t – 175) + 12.05.
Question 6.
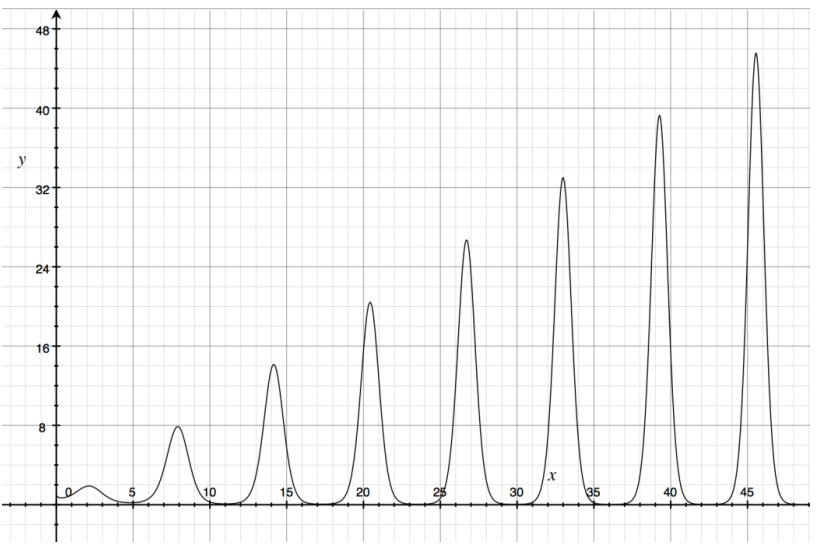
The function graphed below is y = xsin(x). Blake says, “The function repeats on a fixed interval, so it must be a sinusoidal function.” Respond to his argument.
Answer:
While the equation for the function includes a sine function within it, the function itself is not a sinusoidal function. It does not have a constant amplitude or midline, though it does appear to become zero at fixed increments; it does not have a period because the function values do not repeat. Thus, it is not a periodic function and is not sinusoidal.
Eureka Math Algebra 2 Module 2 Lesson 13 Exit Ticket Answer Key
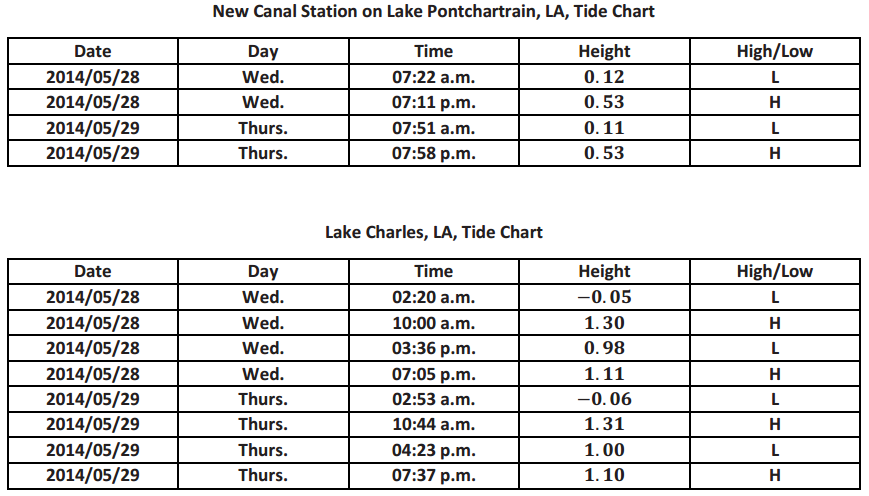
Tidal data for New Canal Station, located on the shore of Lake Pontchartrain, LA, and Lake Charles, LA, are shown below.
Question 1.
Would a sinusoidal function of the form f(x) = A sin(ω(x – h)) + k be appropriate to model the given data for each location? Explain your reasoning.
Answer:
The data for New Canal Station could be modeled with a sinusoidal function, but the other data would not work very well since there appear to be two different low tide values that vary by approximately afoot.
Question 2.
Write a sinusoidal function to model the data for New Canal Station.
Answer:
The amplitude is \(\frac{(0.53-0.115)}{2}\) = 0. 2075. The period appears to be approximately 24. 5 hours. The value of k that determines the midline is \(\frac{0.53+0.115}{2}\) = 0.3225. Since the graph starts at its lowest value at 7:22 a.m., use a negative cosine function with a horizontal shift of approximately 7.4.
f(x) = – 0.2075 cos(\(\frac{2 \pi}{24.5}\)(x – 7.4)) + 0. 3225