Engage NY Eureka Math Algebra 1 Module 5 Lesson 9 Answer Key
Eureka Math Algebra 1 Module 5 Lesson 9 Example Answer Key
Example 1.
Marymount Township secured the construction of a power plant, which opened in 1990. Once the power plant opened in 1990, the population of Marymount increased by about 20% each year for the first ten years and then increased by 5% each year after that.
a. If the population was 150, 000 people in 2010, what was the population in 2000?
Answer:
Sample Response: We can tell that this problem involves a geometric sequence because we are multiplying each term by either 1.2 or 1.05.
This is also a piecewise function since the first ten years the population grows at one rate, and after that it grows at a different rate.
We need to start backward from 2010 to 2000, since we know the size of the population for 2010.
Geometric sequence: an = a1 rn
2000 to 2010
150 000 = a1 (1.05)10 → \(\frac{150000}{(1.05)^{10}}\) = a1 → a1 = 92 086.99 ≈ 92 087
b. How should you round your answer? Explain.
Answer:
The 2010 value appears to be rounded to the nearest thousand (150, 000). We will use a similar level of precision in our result: 92, 000.
c. What was the population in 1990?
Answer:
Sample Response: For 1990 to 2000 we know the final population from our answer to part (a), so we can use that to find the initial population in 1990. Note: For this sample response, we rounded off to 92, 000 people.
92 087 = a1 (1.2)10 → \(\frac{92087}{(1.2)^{10}}\) = a1 → a1 = 14 872.56, so 15 000
Example 2.
If the trend continued, what would the population be in 2009?
Answer:
Sample response: Since that is one year before the end of our sample, we can divide 150, 000 by 1.05 to find the value before it.
\(\frac{150000}{1.05}\) ≈ 143 000
Eureka Math Algebra 1 Module 5 Lesson 9 Exercise Answer Key
Opening Exercise
What does it mean to attend to precision when modeling in mathematics?
Answer:
Using clear and accurate language when interpreting the meaning and discussing the results of the mathematical model; labeling axes on a graph; specifying the meaning of a variable in a particular function; including units of measure when appropriate; showing mathematical work clearly using correct mathematical symbols and notations; making accurate calculations and checking for the reasonableness of the calculations.
Exercises
Exercise 1.
A tortoise and a hare are having a race. The tortoise moves at 4 miles per hour. The hare travels at 10 miles per hour. Halfway through the race, the hare decides to take a 5 – hour nap and then gets up and continues at 10 miles per hour.
a. If the race is 40 miles long, who won the race? Support your answer with mathematical evidence.
Answer:
The time for the tortoise to finish is \(\frac{40 \text { miles }}{4 \mathrm{mph}}\), or 10 hours. The time for the hare to finish is \(\frac{40 \text { miles }}{4 \mathrm{mph}}\) + 5 hours , or 9 hours. So, the hare beat the tortoise by one hour.
b. How long (in miles) would the race have to be for there to be a tie between the two creatures, if the same situation (as described in Exercise 1) happened?
Answer:
Sample solution: Let the tortoise’s time be Tt and the hare’s time be Th.
Tt = \(\frac{D}{4}\)
Th = \(\frac{D}{10}\) + 5 (racing + napping)
Since both creatures finished the same distance D in the same TOTAL time,
Tt = Th
\(\frac{D4latex] = [latex]\frac{D}{10}\) + 5
D = 33 \(\frac{1}{3}\)
The race would need to be 33 \(\frac{1}{3}\) miles in order for there to be a tie.
Check: Tt = \(\frac{33 \frac{1}{3}}{4}\) = 8 \(\frac{1}{3}\) Th = \(\frac{33 \frac{1}{3}}{10}\) + 5 = 8 \(\frac{1}{3}\)
Exercise 2.
The graph on the right represents the value V of a popular stock. Its initial value was $12/share on day 0.
Note: The calculator uses X to represent t, and Y to represent V.
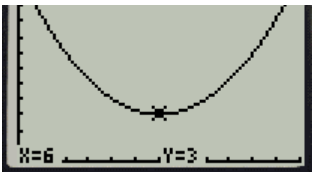
a. How many days after its initial value at time t = 0 did the stock price return to $12 per share?
Answer:
By the symmetry of quadratic equations, the stock must return to its initial value after 6 more days, at t = 12.
b. Write a quadratic equation representing the value of this stock over time.
Answer:
Since the quadratic equation reaches a minimum at (6, 3), use vertex form to write V = a(t – 6)2 + 3. The initial value at t = 0 was 12. So, by substitution, 12 = a(0 – 6)2 + 3 → a = \(\frac{1}{4}\). Therefore, the final equation is V = \(\frac{1}{4}\) (t – 6)2 + 3.
c. Use this quadratic equation to predict the stock’s value after 15 days.
Answer:
V = \(\frac{1}{4}\) (15 – 6)2 + 3 → V = 23.25
The predicted value of the stock after 15 days is $23.25.
Eureka Math Algebra 1 Module 5 Lesson 9 Problem Set Answer Key
Question 1.
According to the Center for Disease Control and Prevention, the breast cancer rate for women has decreased at 0.9% per year between 2000 and 2009.
a. If 192, 370 women were diagnosed with invasive breast cancer in 2009, how many were diagnosed in 2005? For this problem, assume that there is no change in population from 2005 and 2009.
Answer:
Geometric sequence: Common ratio is (1 – 0.009) = 0.991.
an = a1 (common ratio)n – 1
192 370 = a1 (0.991)4
\(\frac{192370}{(0.991)^{4}}\) = a1
a1 = 199 453.98…
a1 = 199, 454
b. According to the American Cancer Society, in 2005 there were 211, 240 people diagnosed with breast cancer. In a written response, communicate how precise and accurate your solution in part (a) is, and explain why.
Answer:
My solution is precise because my classmates and I followed the same protocols and our values were similar to each other. Since the model we used did not take into account the population increase, our values were off by 11, 786 people, which is 5.6%. I believe that being off by only 5.6% is still pretty close to the actual value. My solution was precise and accurate; it could have been more accurate if the population growth was taken into account in the exponential model.
Question 2.
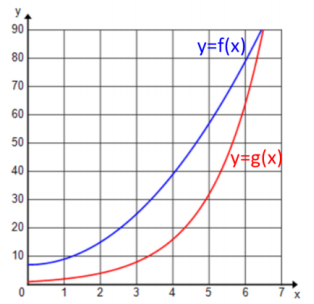
The functions f and g represent the population of two different kinds of bacteria, where x is the time (in hours) and f and g are the number of bacteria (in thousands). f(x) = 2x2 + 7 and g(x) = 2x.
a. Between the third and sixth hour, which bacteria had a faster rate of growth?
Answer:
Looking at the graphs of the two functions, the graph of y = g(x) is steeper over the interval [3, 6] than the graph of y = f(x). Therefore, the bacteria population represented by y = g(x) has a faster rate of growth on this interval.
Using the functions to find the average rate of change over the interval [3, 6],
\(\frac{f(6) – f(3)}{6 – 3}\) = \(\frac{79 – 25}{3}\) = 18
\(\frac{g(6) – g(3)}{6 – 3}\) = \(\frac{64 – 8}{3}\) ≈ 18.7
g has a slightly higher average rate of change on this interval.
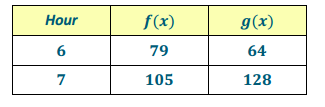
b. Will the population of g ever exceed the population of f? If so, at what hour?
Answer:
Since the question asks for the hour (not the exact time), I made a table starting at the 6th hour and compared the two functions. Once g exceeded f, I stopped. So, sometime in the 7 th hour, the population of g exceeds the population of f.
Eureka Math Algebra 1 Module 5 Lesson 9 Exit Ticket Answer Key
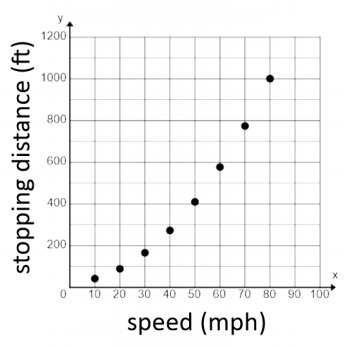
The distance a car travels before coming to a stop once a driver hits the brakes is related to the speed of the car when the brakes were applied. The graph of f (shown) is a model of the stopping distance (in feet) of a car traveling at different speeds (in miles per hour).
Question 1.
One data point on the graph of f appears to be (80, 1000). What do you think this point represents in the context of this problem? Explain your reasoning.
Answer:
In this problem, 80 would represent the speed in miles per hour and 1, 000 would represent the stopping distance in feet. It does not make sense for a car to be traveling at 1, 000 mph, much less only take 80 ft. to come to a stop.
Question 2.
Estimate the stopping distance of the car if the driver is traveling at 65 mph when she hits the brakes. Explain how you got your answer.
Answer:
I can estimate the stopping distance by sketching a curve to connect the data points and locating the y – coordinate of a point on this curve when its x – coordinate is 65. My estimate is approximately 670 ft.
Alternately, assume this is a quadratic function in the form f(x) = kx2, where f is the stopping distance, in feet, and x is the speed, in miles per hour. Using the point (80, 1000), k = \(\frac{1000}{80^{2}}\) = 0.15625, so f(x) = 0.15625x2. Using this model, f(65) = 660.15625. My estimate is approximately 660 ft.
Question 3.
Estimate the average rate of change of f between x = 50 and x = 60. What is the meaning of the rate of change in the context of this problem?
Answer:
f(50) ≈ 400 and f(60) ≈ 580. \(\frac{580 – 400}{10}\) = 18. The average rate of change between x = 50 and x = 60 is approximately 18 ft/mph. This means that between 50 and 60 mph, the stopping distance is increasing by approximately 18 ft. for each additional mph increase in speed.
Question 4.
What information would help you make a better prediction about stopping distance and average rate of change for this situation?
Answer:
A table of data or an algebraic function would help in making better predictions.