Engage NY Eureka Math Algebra 1 Module 4 Mid Module Assessment Answer Key
Eureka Math Algebra 1 Module 4 Mid Module Assessment Task Answer Key
Question 1.
A rectangle with positive area has length represented by the expression 3x2 + 5x – 8 and width by 2x2 + 6x. Write expressions in terms of x for the perimeter and area of the rectangle. Give your answers in standard polynomial form and show your work.
a. Perimeter:
Answer:
2(3x2 + 5x – 8) + 2(2x2 + 6x)
= 6x2 + 10x – 16 + 4x2 + 12x
= 10x2 + 22x – 16
b. Area:
Answer:
(3x2 + 5x – 8)(2x2 + 6x)
= 6x4 + 18x3 + 10x3 + 30x2 – 16x2 – 48x
= 6x4 + 28x3 + 14x2 – 48x
c. Are both your answers polynomials? Explain why or why not for each.
Answer:
Yes, both have terms with only whole number exponents (greater than or equal to 0), coefficients that are real numbers, and a leading coefficient that is not 0.
d. Is it possible for the perimeter of the rectangle to be 16 units? If so, what value(s) of x will work? Use mathematical reasoning to explain how you know you are correct.
Answer:
10x2 + 22x – 16 = 16
10x2 + 22x – 32 = 0
2(5x2 + 11x – 16) = 0
2(5x + 16)(x – 1) = 0
So x = – \(\frac{16}{5}\) or 1 OR -3.2 or 1
If x = 1, the length would be 3(1)2 + 5(1) – 8 = 0; therefore, x ≠ 1.
If x = -3.2, the length would be 3(-3.2)2 + 5(–3.2) – 8 = 3(10.24) – 16 – 8 = 30.72 – 24 = 6.72, and the width would be 2(-3.2)2 + 6(-3.2) = 20.48 – 19.2 = 1.28.
Check: 2(length) + 2(width) = 2(6.72) + 2(1.28) = 13.44 + 2.56 = 16
Yes, the perimeter could be 16 units with length 6.72 and width 1.28.
e. For what value(s) of the domain will the area equal zero?
Answer:
In factored form: (3x2 + 5x – 8)(2x2 + 6x) = (3x + 8)(x – 1)(2x)(x + 3) = 0
The Area = 0 when x = –\(\frac{8}{3}\), 1, 0, or –3.
f. The problem states that the area of the rectangle is positive. Find and check two positive domain values that produce a positive area.
Answer:
Check the values around those we found in part (e), since on either side of the zeros there is likely to be either positive or negative values.
Try substituting x = 2 into the factored form. The factors will then be (+)(+)(+)(+)>0.
So, all numbers greater than 1 will give positive results (x = 3, etc.).
Note: If there are any, there must be an even number of negative factors, and any pair of negative factors must be for the same dimension.
g. Is it possible that negative domain values could produce a positive function value (area)? Explain why or why not in the context of the problem.
Answer:
As long as the dimensions are positive, it is possible that the value of x is negative. That means that either two of the four factors must be negative, and the negative factors must both be from the same dimension (length or width), or all four of the factors must be negative. Using the logic in part (f), it is possible that numbers less than –\(\frac{8}{3}\) or possibly between 0 and –\(\frac{8}{3}\) might work.
Let’s try x = –4: The factors would be (–)(–)(–)(–). This one works since both dimensions will be positive.
Let’s try x = –1: The factors would be (+)(–) …. I can stop now because the length is negative, which is impossible in the context of the problem.
So, the answer is YES. There are negative values for x that produce positive area. They are less than –\(\frac{8}{3}\), and they result in both positive dimensions and positive area.
Question 2.
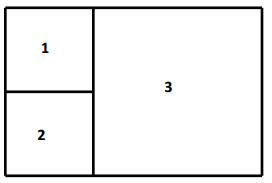
A father divided his land so that he could give each of his two sons a plot of his own and keep a larger plot for himself. The sons’ plots are represented by squares 1 and 2 in the figure below. All three shapes are squares. The area of square 1 equals that of square 2, and each can be represented by the expression 4x2 – 8x + 4.
a. Find the side length of the father’s plot, which is square 3, and show or explain how you found it.
Answer:
4x2 – 8x + 4 is a perfect square that factors to
(2x – 2)2.
The side length is the square root of (2x – 2)2, which is (2x – 2).
The father’s plot is twice the length of one of the smaller squares, or the sum of the two.
The side length for plot 3 is 2(2x – 2) = 4x – 4.
b. Find the area of the father’s plot, and show or explain how you found it.
Answer:
The area of the father’s plot is the square of the side length:
(4x – 4)2 = 16x2 – 32x + 16.
c. Find the total area of all three plots by adding the three areas, and verify your answer by multiplying the outside dimensions. Show your work.
Answer:
By adding the areas of the three squares:
(4x2 – 8x + 4) + (4x2 – 8x + 4) + (16x2 – 32x + 16) = 24x2 – 48x + 24.
By multiplying total length by total width:
Total length = (2x – 2) + (4x – 4) = 6x – 6;
Total width = (2x – 2) + (2x – 2) = 4x – 4;
Area = (6x – 6)(4x – 4) = 24x2 – 48x + 24.
Question 3.
The baseball team pitcher was asked to participate in a demonstration for his math class. He took a baseball to the edge of the roof of the school building and threw it up into the air at a slight angle so that the ball eventually fell all the way to the ground. The class determined that the motion of the ball from the time it was thrown could be modeled closely by the function
h(t)=-16t2 + 64t + 80,
where h represents the height of the ball in feet after t seconds.
a. Determine whether the function has a maximum value or a minimum value. Explain your answer mathematically.
Answer:
The function has a maximum because the leading coefficient is negative, making the graph of the function open down.
b. Find the maximum or minimum value of the function. After how many seconds did the ball reach this value? Show how you found your answers.
Answer:
To find the zeros of the function, we factor as follows:
–16(t2 – 4t – 5) = –16(t – 5)(t + 1) = 0.
So, t = –1 or 5. Therefore, the t-coordinate of the vertex is t = \(\frac{-1+5}{2}\) = 2.
If we substitute 2 for t into the original function, we find that the vertex is at (2, 144); this tells us that the maximum height is 144 ft., which occurs at 2 seconds.
c. For what interval of the domain is the function increasing (i.e., ball going up)? For what interval of the domain is the function decreasing (i.e., ball going down)? Explain how you know.
Answer:
The function is increasing from 0 to 2 seconds and decreasing from 2 to 5 seconds. The rate of change over [0, 2] is positive. The rate of change over [2, 5] is negative. For an answer based on the graph: The graph has positive slope from 0 to 2 seconds and negative slope from 2 to 5 seconds.
d. Evaluate h(0). What does this value tell you? Explain in the context of the problem.
Answer:
h(0) = 80. This is the initial height, the height at which the ball was when it was thrown upward. The roof was 80 ft. high.
e. How long is the ball in the air? Explain your answer.
Answer:
The ball is in the air for 5 seconds. When t = 0, the ball is released. When t = 5, the height is 0, which means the ball hits the ground 5 seconds after it is thrown.
f. State the domain of the function, and explain the restrictions on the domain based on the context of the problem.
Answer:
We consider the experiment over at the time the ball reaches the ground, so it must be less than or equal to 5. Additionally, the values for t as described in this context must be greater than or equal to 0 because time began when the ball was thrown.
t: {0 ≤ t ≤ 5}
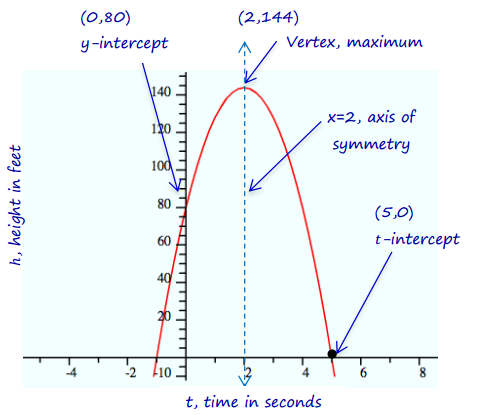
g. Graph the function indicating the vertex, axis of symmetry, intercepts, and the point representing the ball’s maximum or minimum height. Label your axes using appropriate scales. Explain how your answer to part (d) is demonstrated in your graph.

Answer:
The graph shows the function crossing the y-axis at (0, 80), the height at which the ball was thrown. Then, it travels to a height of 144 ft. at 2 seconds, and hits the ground at 5 seconds.
h. Does your graph illustrate the actual trajectory of the ball through the air as we see it?
Answer:
No, the graph does not illustrate the actual trajectory of the ball through the air because movement along the horizontal axis represents changes in time, not horizontal distance. The ball could be going straight up and then straight down with very little change in horizontal position, and the graph would be the same.