Engage NY Eureka Math Algebra 1 Module 3 Mid Module Assessment Answer Key
Eureka Math Algebra 1 Module 3 Mid Module Assessment Task Answer Key
Question 1.
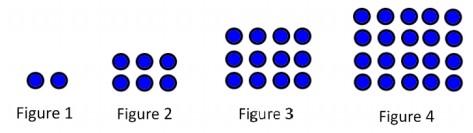
The diagram below shows how tables and chairs are arranged in the school cafeteria. One table can seat 4 people, and tables can be pushed together. When two tables are pushed together, 6 people can sit around the table.
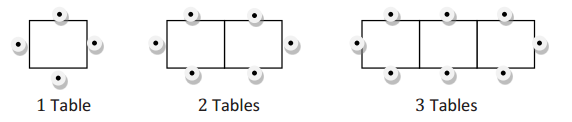
a. The diagram below shows how tables and chairs are arranged in the school cafeteria. One table can seat 4 people, and tables can be pushed together. When two tables are pushed together, 6 people can sit around the table.
Answer:
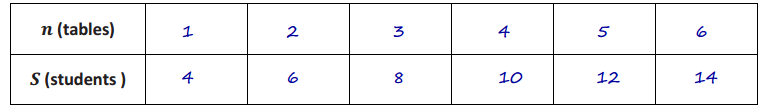
b. If we make a sequence where the first term of the sequence is the number of students who can fit at one table, the second term of the sequence is the number of students who can fit at two tables, and so on, will the sequence be arithmetic, geometric, or neither? Explain your reasoning.
Answer:
It would be an arithmetic sequence because every term is 2 more than the previous term.
c. Create an explicit formula for a sequence that models this situation. Use n = 1 as the first term representing how many students can sit at one table. How do the constants in your formula relate to the situation?
Answer:
f(n) = 4 + 2(n – 1)
4 is the number of students who can be seated at one table by itself.
2 is the number of additional students who can be seated each time a table is added.
d. Using this seating arrangement, how many students could fit around 15 tables pushed together in a row?
Answer:
f(15) = 4 + 2(15 – 1) = 32
The cafeteria needs to provide seating for 189 students. They can fit up to 15 rows of tables in the cafeteria. Each row can contain at most 9 tables but could contain fewer than that. The tables on each row must be pushed together. Students will still be seated around the tables as described earlier.
e. If they use exactly 9 tables pushed together to make each row, how many rows will they need to seat 189 students? What will be the total number of tables used to seat all of the students?
Answer:
f(9) = 4 + 2(9 – 1) = 20
9 tables pushed together seats 20 students.
It will take 10 rows to get enough rows to seat 189 students.
10 rows of 9 tables each is 90 tables.
f. Is it possible to seat the 189 students with fewer total tables? If so, what is the fewest number of tables needed? How many tables would be used in each row? (Remember that the tables on each row must be pushed together.) Explain your thinking.
Answer:
Yes. They would use the fewest tables to seat the 189 students if they use all of the 15 rows, because with each new row, you get the added benefit of the 2 students who sit on each end of the row.
Any arrangement that uses 80 total tables spread among all 15 rows will be the best. There would be 1 extra seat but no extra tables.
One solution that evens out the rows pretty well but still uses as few tables as possible would be 5 rows of 6 tables and 10 rows of 5 tables.
Another example that has very uneven rows would be 8 rows of 9 tables, 1 row of 2 tables, and 6 rows of 1 table.
Question 2.
Sydney was studying the following functions:
f(x) = 2x + 4 and g(x) = 2(2)x + 4
She said that linear functions and exponential functions are basically the same. She based her statement on plotting points at x = 0 and x = 1 and graphing the functions.
Help Sydney understand the difference between linear functions and exponential functions by comparing and contrasting f and g. Support your answer with a written explanation that includes use of the average rate of change and supporting tables and/or graphs of these functions.
Answer:
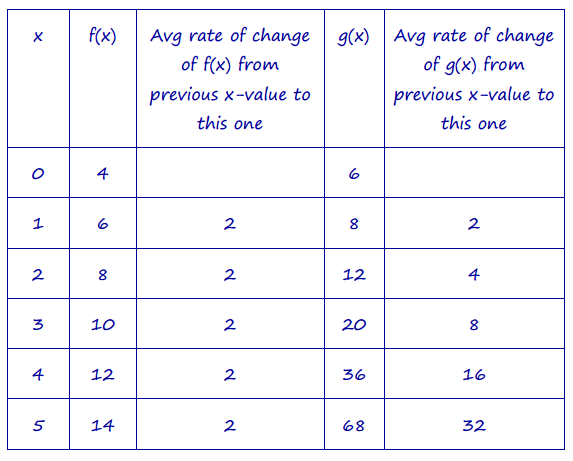
Linear functions have a constant rate of change. f(x) increases by 2 units for every 1 unit that x increases. Exponential functions do not have a constant rate of change. The rate of change of g(x) is increasing as x increases. The average rate of change across an x interval of length 1 doubles for each successive x interval of length 1. No matter how large the rate of change is for the linear function, there is an x-value at which the rate of change for the exponential function will exceed the rate of change for the linear function.
Question 3.
Dots can be arranged in rectangular shapes like those shown below.
a. Assuming the trend continues, draw the next three shapes in this particular sequence of rectangles. How many dots are in each shape you drew?
Answer:
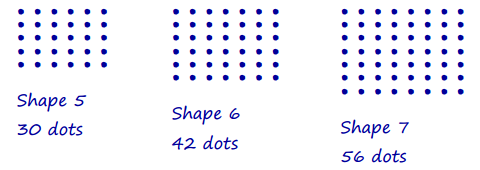
The numbers that represent the number of dots in this sequence of rectangular shapes are called rectangular numbers. For example, 2 is the first rectangular number, and 6 is the second rectangular number.
b. What is the fiftieth rectangular number? Explain how you arrived at your answer.
Answer:
50(51) = 2550
The 1st figure had 1 row and 2 columns, giving 1(2) dots. The 2nd figure had 2 rows and 3 columns, giving 2(3) dots. The pattern for the nth figure is n rows and n+1 columns. So, the 50th figure will have 50(51) dots.
c. Write a recursive formula for the rectangular numbers.
Answer:
f(1) = 2 = 1•2
f(2) = 6 = 2•3 = f(1) + 4
f(3) = 12 = 3•4 = f(2) + 6
f(4) = 20 = 4•5 = f(3) + 8
f(n) = f(n – 1) + 2n; natural number n > 1, and f(1) = 2
d. Write an explicit formula for the rectangular numbers.
Answer:
f(n) = n(n + 1); natural number n > 0
e. Could an explicit formula for the nth rectangular number be considered a function? Explain why or why not. If yes, what would the domain and range of the function be?
Answer:
Yes. Consider the domain to be all the integers greater than or equal to 1 and the range to be all the rectangular numbers. Then, every element in the domain corresponds to exactly one element in the range.
Question 4.
Stephen is assigning parts for the school musical.
a. Suppose there are 20 students participating, and he has 20 roles available. If each of the 20 students is assigned exactly one role in the play, and each role played by only one student, would assigning the roles in this way be an example of a function? Explain why or why not. If yes, state the domain and range of the function.
Answer:
Yes. Since every student gets a role and every role gets a student, and there are exactly 20 roles and 20 students, there is no possibility that a student is given more than one role or that a role is given to more than one student. Therefore, the domain could be the list of students with the range being the list of roles, or we could consider the domain to be the list of roles and the range to be the list of students. Either way, you would have an example of a function.
Stephen is assigning parts for the school musical.
b. Suppose there are 20 students participating, and he has 20 roles available. If each of the 20 students is assigned exactly one role in the play, and each role played by only one student, would assigning the roles in this way be an example of a function? Explain why or why not. If yes, state the domain and range of the function.
Answer:
Yes. Each element of the domain (the instrumental parts) are assigned to one and only one element in the range (the musicians).
A(Piano) = Scott means that the part of the piano is being played by Scott.
c. Suppose there are 10 instrumental parts but 13 musicians in the orchestra. The conductor assigns an instrumental part to each musician. Some instrumental parts will have two musicians assigned so that all the musicians have instrumental parts. When two musicians are assigned to one part, they alternate who plays at each performance of the play. If the instrumental parts are the domain, and the musicians are the range, is the assignment of instrumental parts to musicians as described sure to be an example of a function? Explain why or why not. If so, what would be the meaning of A(piano) = Scott?
Answer:
No. If the instrumental parts are the domain, then it cannot be an example of a function because there are 3 cases where one element in the domain (the instrumental parts) will be assigned to more than one element of the range (the musicians).
Question 5.
The population of a remote island has been experiencing a decline since the year 1950. Scientists used census data from 1950 and 1970 to model the declining population. In 1950 the population was 2,350. In 1962 the population was 1,270. They chose an exponential decay model and arrived at the function: P(x) = 2350(0.95)x,x≥0, where x is the number of years since 1950. The graph of this function is given below.
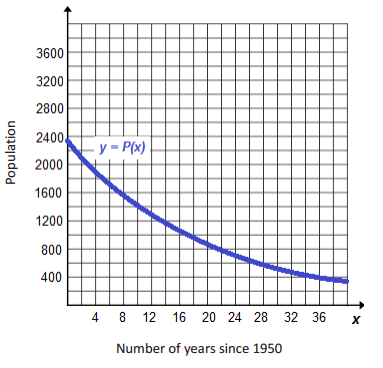
a. What is the y-intercept of the graph? Interpret its meaning in the context of the problem.
Answer:
The y-intercept is the point (0, 2350). When x is 0, there have been 0 years since 1950, so in the year 1950, the population was 2,350.
b. Over what intervals is the function increasing? What does your answer mean within the context of the problem?
Answer:
There are no intervals in the domain where it is increasing. This means that the population is always decreasing, never increasing.
c. Over what intervals is the function decreasing? What does your answer mean within the context of the problem?
Answer:
The function is decreasing over its entire domain: [0, ∞). This means that the population will continue to decline, except eventually when the function value is close to zero; then, essentially the population will be zero from that point forward.
Another group of scientists argues that the decline in population would be better modeled by a linear function. They use the same two data points to arrive at a linear function.
d. Write the linear function that this second group of scientists uses.
Answer:
L(x) = \(\frac{(1270-2350)}{12}\) x + 2350
L(x) = -90x + 2350
e. What is an appropriate domain for the function? Explain your choice within the context of the problem.
Answer:
D: 0 ≤ x ≤ 26\(\frac{1}{9}\)
We are only modeling the decline of the population, which scientists say started in 1950, so that means x starts at 0 years past 1950. Once the population hits zero, which occurs 26\(\frac{1}{9}\) years past 1950, the model no longer makes sense because population cannot be a negative number.
f. Graph the function on the coordinate plane.
Answer:
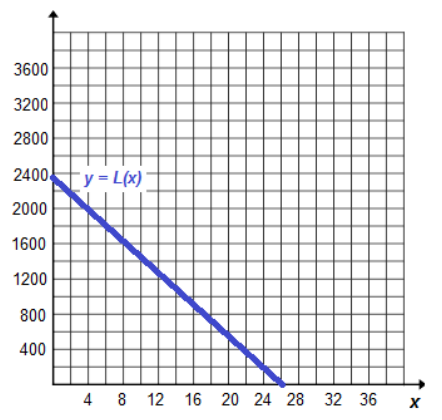
g. What is the x-intercept of the function? Interpret its meaning in the context of the problem.
Answer:
(26 \(\frac{1}{9}\) , 0 )
At 26 \(\frac{1}{9}\) years past 1950, in the year 1976, the population will be zero.