Engage NY Eureka Math Algebra 1 Module 5 Lesson 4 Answer Key
Eureka Math Algebra 1 Module 5 Lesson 4 Example Answer Key
Example 1.
Read the problem below. Your teacher will walk you through the process of using the steps in the modeling cycle to guide your solution.
The relationship between the length of one of the legs, in feet, of an animal and its walking speed, in feet per second, can be modeled by the graph below. Note: This function applies to walking not running speed. Obviously, a cheetah has shorter legs than a giraffe but can run much faster. However, in a walking race, the giraffe has the advantage.
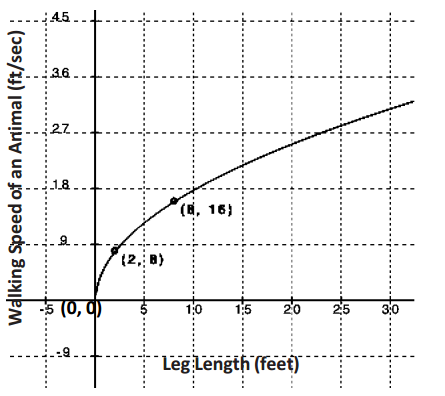
A T – Rex’s leg length was 20 ft. What was the T – Rex’s speed in ft/sec?
Answer:
→ What are the units involved in this problem? Define the quantities and variables you would use to model this graph.
Leg length is in feet, and speed is measured in feet per second, so time is measured in seconds. Use x to represent the number of feet in leg length and f to represent the speed based on leg length.
→ What type of function does this graph represent? What clues in the graph helped you recognize the function?
There are only positive values and it starts at (0,0), so this is probably a square root function, but it could be the right half of a cube root function. I need to check a few points to be sure.
After you get the correct response to the first question, draw or project the following three transformations of the square root function on the board or screen: f(x) = \(\sqrt{x}\), g(x) = \(\sqrt{ax}\), h(x) = \(\sqrt{(x – b)}\).
→ Which transformation of the function does this graph represent? How can we determine that?
Sample Response: f cannot be the form because the square root of 2 is not 8, so it is either g or h. We can test both forms by substituting the x – and y – values from the points provided to us.
First, check the form: g(x) = \(\sqrt{ax}\).
(2,8)→8 = \(\sqrt{2a}\) → 64 = 2a→a = 32
(8,16)→16 = \(\sqrt{8a}\) → 256 = 8a→a = 32
Since we got a = 32 for both ordered pairs, it appears that g is the correct form and that g(x) = \(\sqrt{32x}\).
To make sure, we will also check the form: h(x) = \(\sqrt{(x – b)}\).
(2,8) → 8 = \(\sqrt{(2 – b)}\) → 82 = 2 – b → 64 = 2 – b → b = – 62
(8,16) → 16 = \(\sqrt{(8 – b)}\) → 162 = 8 – b → 256 = 8 – b → b = – 248
The function cannot be h.
→ Is the problem solved?
We are not finished. Now we need to use the function we found to calculate the speed of the T – Rex with a 20 – foot leg using g(x) = \(\sqrt{32x}\).
What is the walking speed of the T – Rex?
g(20) = \(\sqrt{(32)(20)}\) → g(20) = \(\sqrt{640}\) → g(20) = 8\(\sqrt{10}\), or about 25 feet per second.
→ What if we doubled the length of T – Rex’s legs? Would the T – Rex walk twice as fast?
A square root function does not double if the input is doubled. The graph shows that when the input went from 2 to 8, the output does not quadruple. A proportional relationship would have a double – the – input – double – the – output effect, but a square root function is not proportional. A proportional relationship between two quantities must be linear. If we look at the Eduardo graph (Exercise 1), we can see a proportional relationship.
Eureka Math Algebra 1 Module 5 Lesson 4 Exercise Answer Key
Exercises
Now practice using the modeling cycle with these problems:
Exercise 1.
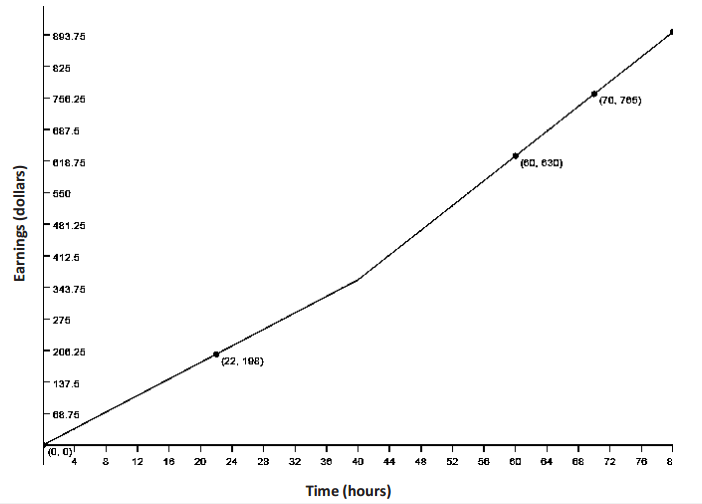
Eduardo has a summer job that pays him a certain rate for the first 40 hours per week and time and a half for any overtime. The graph below is a representation of how much money he earns as a function of the hours he works in one week.
Eduardo’s employers want to make him a salaried employee, which means he does not get overtime. If they want to pay him $480 per week but have him commit to 50 hours a week, should he agree to the salary change? Justify your answer mathematically.
a. Formulate (recall this step from Lesson 1).
i. What type of function can be represented by a graph like this (e.g., quadratic, linear, exponential, piecewise, square root, or cube root)?
Answer:
The graph is of a function that is piecewise defined and made up of two linear functions.
ii. How would you describe the end behavior of the graph in the context of this problem?
Answer:
As x gets infinitely large, so does the function. However, realistically there is a limit to how many hours per week he can work, so there is a maximum value for this function.
iii. How does this affect the equation of our function?
Answer:
The slope for each graph is positive. We may need to state restrictions on the domain and also on the range.
b. Compute
i. What strategy do you plan to use to come up with the model for this context?
Answer:
Identify the domains for each piece (linear function) in the piecewise function. Find the slope and y – intercept for each linear piece, and then put the equations in slope – intercept form.
ii. Find the function of this graph. Show all your work.
Answer:
For the lower piece, domain: 0 ≤ x ≤ 40.
The y – intercept is 0, and the given points in that domain are (0,0) and (22,198). To calculate the slope \(\frac{198}{22}\) = 9.
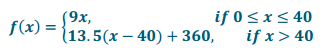
f(x) = 9x if 0 ≤ x ≤ 40
For the upper piece, domain: 40 < x. This part of the problem requires using not only the graph but also the context from the problem. Up to this point, Eduardo has worked 40 hours and has earned 9 dollars an hour. 40∙9 = 360. This is the y – value when x = 40 for the second linear equation. Again, we find the slope of the equation by selecting two points (70,765) and (60,630). \(\frac{765 – 630}{70 – 60}\) = \(\frac{135}{10}\) = 13.50. Looking at the graph, we also see that the second line was moved 40 units to the right (translated), so x is (x – 40).
f(x) = 13.5(x – 40) + 360 if x > 40
c. Interpret
i. How much does Eduardo make an hour?
Answer:
Eduardo makes an hourly rate of $9 if 0 ≤ x ≤ 40 and $13.50 if x > 40.
ii. By looking only at the graphs, which interval has a greater average rate of change: x<20 or x>45? Justify your answer by making connections to the graph and its verbal description.
Answer:
The verbal description states that Eduardo gets paid more after 40 hours of work. If you look at how steep the graph is after 45 hours, you can see that it is increasing at a faster rate than when it was 20 hours or less.
iii. Eduardo’s employers want to make Eduardo a salaried employee, which means he does not get overtime. If they want to pay him $480 per week but have him commit to 50 hours a week, should he agree to the salary change? Justify your answer mathematically.
Answer:
f(50) = 13.5(50 – 40) + 360→13.5(10) + 360→135 + 360 = $495. He would get paid more as an hourly employee if he worked 50 hours a week. It seems that it would be in his best interest to keep the hourly agreement rather than the salary. Students may come up with other responses but should at least understand that Eduardo earns more money for 50 hours of work as an hourly employee than he would as a salaried employee. If students show that understanding, then they have answered the question correctly.
d. Validate
How can you check to make sure your function models the graph accurately?
Answer:
For the values in our graph, we can substitute the x – values into the function to see if the same given y – value is a result.
Exercise 2.
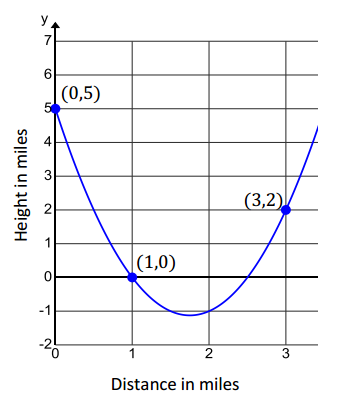
The cross – section view of a deep river gorge is modeled by the graph shown below where both height and distance are measured in miles. How long is a bridge that spans the gorge from the point labeled (1,0) to the other side? How high above the bottom of the gorge is the bridge?
a. Formulate
i. What type of function can be represented by a graph like this (e.g., quadratic, linear, exponential, piecewise, square root, or cube root)?
Answer:
Quadratic
ii. What are the quantities in this problem?
Answer:
The quantities are height relative to the location of the bridge (f) and horizontal distance from the highest point in the gorge (x).
iii. How would you describe the end behavior of the graph?
Answer:
Opening upward
iv. What is a general form for this function type?
Answer:
f(x) = ax2 + bx + c or f(x) = a(x – h)2 + k or f(x) = a(x – m)(x – n)
v. How does knowing the function type and end behavior affect the equation of the function for this graph?
Answer:
The equation is a second – degree polynomial where the leading coefficient is positive.
vi. What is the equation we would use to model this graph?
Answer:
Using the three ordered pairs in the graph:
(0,5): From this pair, we see that c = 5 and f(x) = ax2 + bx + 5
Now substitute the other two ordered pairs to form a linear system:
(1,0): a(1)2 + b(1) + 5 = 0 ⇒ a + b = – 5 ⇒ – 3a – 3b = 15
(3,2): a(3)2 + b(3) + 5 = 2⇒9a + 3b = – 3
From here we see that 6a = 12 and a = 2. So, substituting into the first linear equation, we have b = – 7.
So, the equation is f(x) = 2x2 – 7x + 5.
b. Compute
i. What are the key features of the graph that can be used to determine the equation?
Answer:
The y – intercept and the other two given ordered pairs
ii. Which key features of the function must be determined?
Answer:
The zeros and the vertex must be determined.
iii. Calculate the missing key features, and check for accuracy with your graph.
Answer:
f(x) = 2x2 – 7x + 5
Writing the function in factored form, we find f(x) = (2x – 5)(x – 1). So, the other end of the bridge is at the point (2.5,0). This appears accurate based on the x – intercept of the graph. The vertex is located midway between the x – intercepts. Therefore, the vertex will occur at x = 1.75. Evaluating f at x = 1.75, we find that f(1.75 ) = – 1.125. The vertex is (1.75, – 1.125), which looks to be accurate based on the graph.
c. Interpret
i. What domain makes sense for this context? Explain.
Answer:
Since x is the horizontal distance from (0,5), the domain that makes sense is x>0. In order to know the upper limits of the domain, we would need to know the height of the highest point on the other side of the gorge, which cannot be determined with much accuracy from the given graph. We could assume it is between 3 and 3.5 miles.
ii. How wide is the bridge with one side located at (1,0)?
Answer:
It would be the difference between the x – coordinates of the x – intercepts.
2.5 – 1 = 1.5
The bridge is 1.5 miles wide.
iii. How high is the bridge above the bottom of the gorge?
Answer:
The minimum value of the function represents the lowest point. Since the height shown on the graph is relative to the location of the bridge, the bridge would be 1.125 miles above the bottom of the gorge. The y – coordinate of the minimum point represents that height below the bridge.
iv. Suppose the gorge is exactly 3.5 miles wide from its two highest points. Find the average rate of change for the interval from x = 0 to x = 3.5,[0,3.5]. Explain this phenomenon. Are there other intervals that behave similarly?
Answer:
The average rate of change for that interval is 0. The two points are points of symmetry straight across the curve from each other. The line passing through them is horizontal. Any interval with endpoints that are symmetry points will be horizontal (0 slope).
d. Validate
How can you check to make sure that your function models the graph accurately?
Answer:
We can substitute any x – value from the graph into the function to see if the resulting y – value is reasonable for the graph.
Exercise 3.
Now compare four representations that may be involved in the modeling process. How is each useful for each phase of the modeling cycle? Explain the advantages and disadvantages of each.
Answer:
The verbal description helps us define the quantities and, in this case, write the factored form of the equation for the function. We always need to find another representation to analyze or interpret the situation.
The graph is visual and allows us to see the overall shape and end behavior of the function. We can “see” some integer values of the function but must estimate any non – integer values. The graph is a good way to check calculations to make sure results are reasonable.
The table, in general, does not help us to see shapes (patterns in x – y) any better than the graph does. However, a table with equal x – intervals does help us to see the patterns in y – values very well.
The equation allows us to accurately calculate values of the function for any real number. It can be rewritten in various forms to help us see features of the function (vertex form, standard form, factored form). It allows deep analysis and is sometimes referred to as an analytical model.
Eureka Math Algebra 1 Module 5 Lesson 4 Problem Set Answer Key
Question 1.
During tryouts for the track team, Bob is running 90 – foot wind sprints by running from a starting line to the far wall of the gym and back. At time t = 0, he is at the starting line and ready to accelerate toward the opposite wall. As t approaches 6 seconds he must slow down, stop for just an instant to touch the wall, then turn around, and sprint back to the starting line. His distance, in feet, from the starting line with respect to the number of seconds that has passed for one repetition is modeled by the graph below.
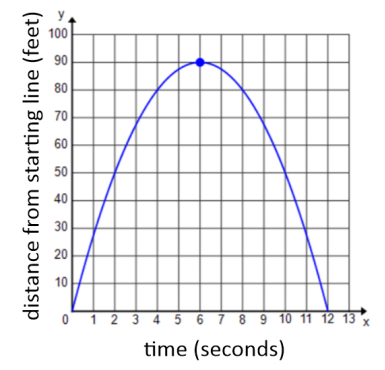
(Note: You may refer to Lesson 1, Problem Set 1 to help answer this question.)
How far was Bob from the starting line at 2 seconds? 6.5 seconds? (Distances, in feet, should be represented to the nearest tenth.)
Answer:
So far we know: f(t) = a(t – 6)2 + 90 (Now we need to find a.)
Substitute (0,0):
a(0 – 6)2 + 90 = 0
a( – 6)2 + 90 = 0
36a = – 90
a = \(\frac{ – 90}{36}\) = \(\frac{ – 5}{2}\)
The final function is f(t) = \(\frac{ – 5}{2}\) (t – 6)2 + 90.
f(2) = \(\frac{ – 5}{2}\) (2 – 6)2 + 90 = 50
f(6.5) = \(\frac{ – 5}{2}\) (6.5 – 6)2 + 90 = 89.4
Bob was 50 ft and 89.4 ft from the starting line at 2 seconds and 6.5 seconds, respectively.
Question 2.
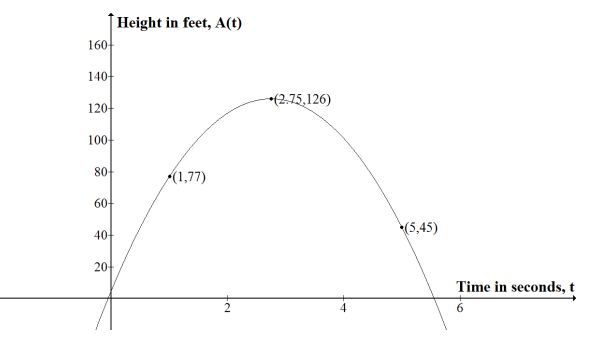
Kyle and Abed each threw a baseball across a field. The height of the balls (in feet) is described by functions A and K, where t is the number of seconds the baseball is in the air. K models the height of Kyle’s baseball (equation below), and A models the height of Abed’s baseball (graph below).
K(t) = – 16t2 + 66t + 6
a. Which ball was in the air for a longer period of time?
Answer:
We need to find the time when the ball is back on the ground (i.e., when the height function equals 0).
First Abed’s:
We can see from the graph that the ball is in the air from t = 0 to somewhere between 4 and 6. So, just by reading the graph, we might estimate the time in the air to be a little more than 5 seconds. We can get a more accurate number by formulating a model and then doing some calculations.
Using the vertex form: A(t) = a(t – 2.75)2 + 126
If we substitute (1,77):
a(1 – 2.75)2 + 126 = 77
3.0625a = – 49
a = – 49/3.0625 = – 16
So, A(t) = – 16(t – 2.75)2 + 126 = 0.
– 16(t – 2.75)2 = – 126
(t – 2.75)2 = – \(\frac{126}{ – 16}\)
(t – 2.75)2 = 7.875
t – 2.75 = ±\(\sqrt{7.875}\)
t = 2.75±\(\sqrt{7.875}\)
t ≈ – 0.06 or 5.6
Only the positive value makes sense in this context, so Abed’s ball was in the air for 5.6 seconds.
Now Kyle’s: K(t) = – 16t2 + 66t + 6 = 0
Using the quadratic formula to find the zeros:
t = \(\frac{ – 66 \pm \sqrt{66^{2} – 4( – 16)(6)}}{2( – 16)} = \frac{ – 66 \pm \sqrt{4740}}{ – 32}\) ≈ – 0.09 or 4.2
Only the positive value makes sense in this context. So Kyle’s ball was in the air for 4.2 seconds.
Abed’s ball was in the air longer.
b. Whose ball goes higher?
ans;
We see in the graph of y = A(t) that the highest point for Abed’s ball is 126 ft. Now we need to find the maximum value for K. One way to find the maximum is to put the equation in vertex form:
K(t) = – 16(t2 – 4.125t + ) + 6
= – 16(t – 2.0625)2 + 6 + 16(2.0625)2
= – 16(t – 2.0625)2 + 6 + 68.0625
= – 16(t – 2.0625)2 + 74.0625
So, the vertex for K is (2.0625,74.0625), and Kyle’s ball went about 74 ft into the air. Abed’s ball went higher.
c. How high was Abed’s ball when he threw it?
Answer:
Now we are looking for the y – intercept for y = A(t) (i.e., the height when time is 0). We can either use the vertex form of the equation, or we can rewrite the equation in standard form.
A(t) = – 16(t – 2.75)2 + 126
= – 16(t2 – 5.5t + 7.5625) + 126
= – 16t2 + 88t – 121 + 126
= – 16t2 + 88t + 5
That means (0,5) is the vertical – intercept, and the ball was at 5 ft when thrown by Abed.
Or we can substitute t = 0 into the vertex form:
A(t) = – 16(t – 2.75)2 + 126
= – 16(0 – 2.75)2 + 126
= – 16(7.5625) + 126
= – 121 + 126
= 5
So, the ball left Abed’s hand at a height of 5 ft.
Eureka Math Algebra 1 Module 5 Lesson 4 Exit Ticket Answer Key
Question 1.
Why might we want to represent a graph of a function in analytical form?
Answer:
Graphs require estimation for many values, and for most we can calculate exact values using the function equation. Some key features that may not be visible or clear on a graph can be seen in the symbolic representation.
Question 2.
Why might we want to represent a graph as a table of values?
Answer:
In a table of values, we can sometimes better see patterns in the relationship between the x – and y – values.