Students can use the Spectrum Math Grade 8 Answer Key Chapter 3 Lesson 3.5 Graphing Linear Equations as a quick guide to resolve any of their doubts.
Spectrum Math Grade 8 Chapter 3 Lesson 3.5 Graphing Linear Equations Answers Key
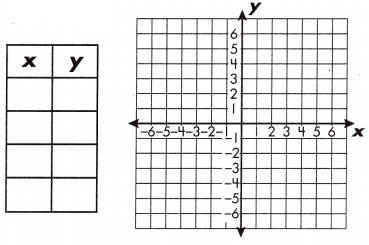
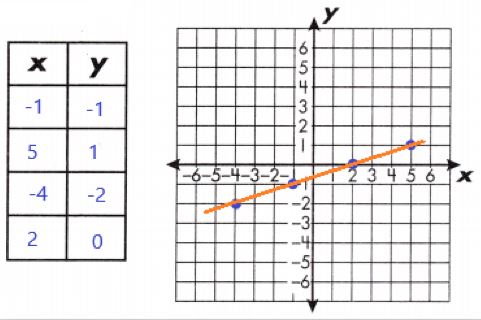
A linear equation is an equation that creates a straight line when graphed on a coordinate plane. To graph a linear equation, create a function table with at least 3 ordered pairs. Then, plot these ordered pairs on a coordinate plane.
y = \(\frac{x}{2}\) + 1
Draw a line through the points. In the table are some points for this linear function:
These points are plotted on the line graph at the far right.
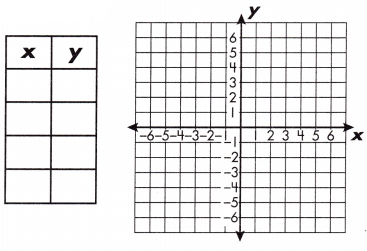
Complete the function table for each function. Then, graph the function.
Question 1.
a. y = x – 3
Answer:
A linear equation is an equation that creates a straight line when graphed on a coordinate plane. To graph a linear equation, create a function table with at least 3 ordered pairs. Then, plot these ordered pairs on a coordinate plane.
Draw a line through the points. In the table are some points for this linear function:
b. y = 2x + 1
Answer:
A linear equation is an equation that creates a straight line when graphed on a coordinate plane. To graph a linear equation, create a function table with at least 3 ordered pairs. Then, plot these ordered pairs on a coordinate plane.
Draw a line through the points. In the table are some points for this linear function:
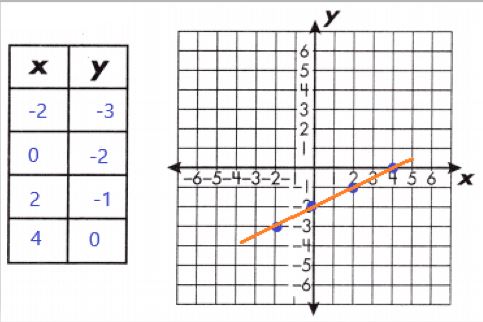
Question 2.
a. y = \(\frac{x}{2}\) – 2
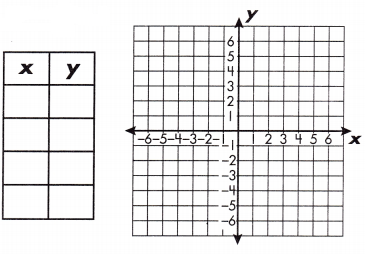
Answer:
A linear equation is an equation that creates a straight line when graphed on a coordinate plane. To graph a linear equation, create a function table with at least 3 ordered pairs. Then, plot these ordered pairs on a coordinate plane.
Draw a line through the points. In the table are some points for this linear function:
b. y = \(\frac{x-2}{3}\)
Answer:
A linear equation is an equation that creates a straight line when graphed on a coordinate plane. To graph a linear equation, create a function table with at least 3 ordered pairs. Then, plot these ordered pairs on a coordinate plane.
Draw a line through the points. In the table are some points for this linear function:
Graph each linear equation using a function table to find the necessary values.
Question 1.
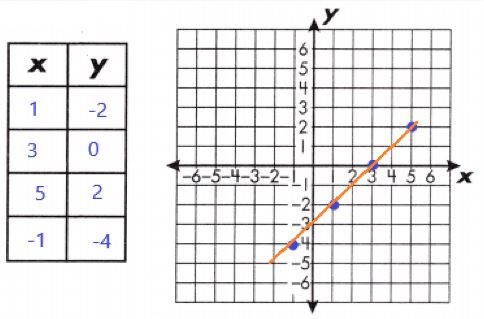
a. y = 2x – 4
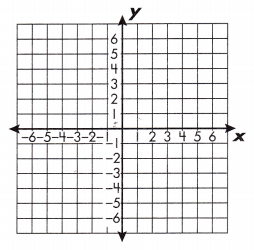
Answer:
(x, y) = (1, -2), (2, 0), (-1, -6), (3, 2)
A linear equation is an equation that creates a straight line when graphed on a coordinate plane. To graph a linear equation, create a function table with at least 3 ordered pairs. Then, plot the above ordered pairs on a coordinate plane.
Draw a line through the points. In the table are some points for this linear function:
b. y = \(\frac{2 x}{3}\)
Answer:
(x, y) = (0,0), (3, 2), (-3, -2), (6, 4)
A linear equation is an equation that creates a straight line when graphed on a coordinate plane. To graph a linear equation, create a function table with at least 3 ordered pairs. Then, plot the above ordered pairs on a coordinate plane.
Draw a line through the points. In the table are some points for this linear function:
Question 2.
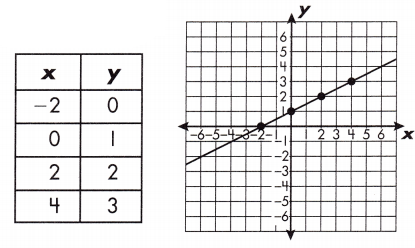
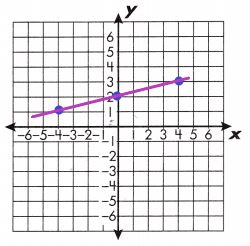
a. y = \(\frac{x}{4}\) + 2
Answer:
(x, y) = (0,2), (4, 3), (-4, 1)
A linear equation is an equation that creates a straight line when graphed on a coordinate plane. To graph a linear equation, create a function table with at least 3 ordered pairs. Then, plot the above ordered pairs on a coordinate plane.
Draw a line through the points. In the table are some points for this linear function:
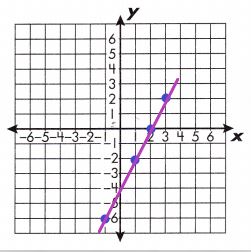
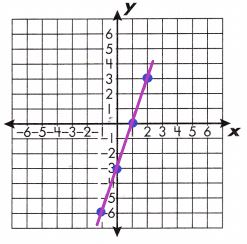
b. y = 3x – 3
Answer:
(x, y) = (0,-3), (1, 0), (2,3), (-1, -6)
A linear equation is an equation that creates a straight line when graphed on a coordinate plane. To graph a linear equation, create a function table with at least 3 ordered pairs. Then, plot the above ordered pairs on a coordinate plane.
Draw a line through the points. In the table are some points for this linear function:
Question 3.
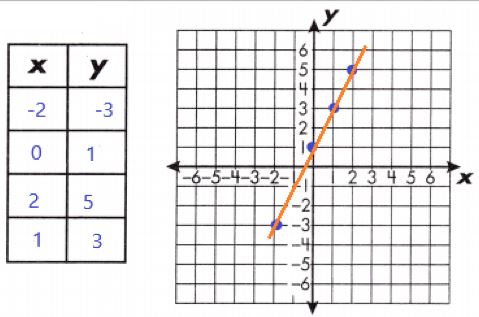
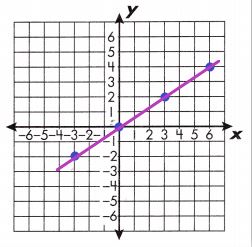
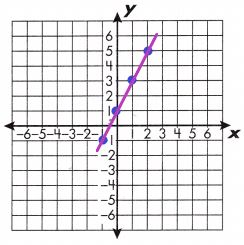
a. y = 2x + 1
Answer:
(x, y) = (0,1), (1, 3), (2,5), (-1, -1)
A linear equation is an equation that creates a straight line when graphed on a coordinate plane. To graph a linear equation, create a function table with at least 3 ordered pairs. Then, plot the above ordered pairs on a coordinate plane.
Draw a line through the points. In the table are some points for this linear function:
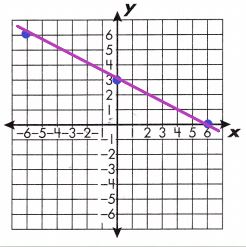
b. y = 3 – \(\frac{x}{2}\)
Answer:
(x, y) = (0,3), (6,0), (-6,6)
A linear equation is an equation that creates a straight line when graphed on a coordinate plane. To graph a linear equation, create a function table with at least 3 ordered pairs. Then, plot the above ordered pairs on a coordinate plane.
Draw a line through the points. In the table are some points for this linear function: