This handy Spectrum Math Grade 7 Answer Key Chapter 6 Lesson 6.4 Comparing Similar Data Sets provides detailed answers for the workbook questions
Spectrum Math Grade 7 Chapter 6 Lesson 6.4 Comparing Similar Data Sets Answers Key
Two data sets with similar characteristics can be compared by examining their distribution and measures of center.

Compare the two data sets by setting them up on a graph.
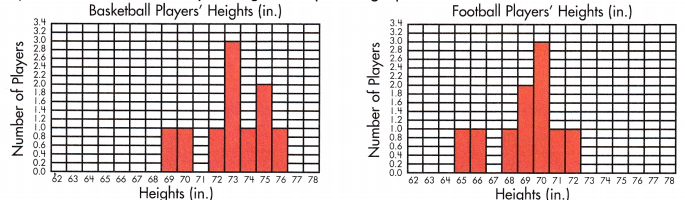
These data sets have a similar range, 7 for both. However, when we look at the data sets spread out along the same scale of measurement, we can see that basketball players are generally taller than football players. This can be verified by finding the mean height of basketball players (73 in.) and the mean height of football players (69 in.).
Examine the distributions and measures of center of the data sets below. Then, write 2 to 3 sentences that compare the sets. Make an inference based on the data.
Question 1.
Compare the calorie counts of 10 different menu items at popular fast food restaurants.

Answer:
The calories range is much wider for restaurant 1 than restaurant 2 (500 as compared to 180).
The mean calories are higher for restaurant 1 than they are for restaurant 2.
The inference is that restaurant 2 is generally healthier.
Explanation:
Given set of date,
Restaurant 1: 550, 520, 610, 600, 540, 750, 250, 670, 510, 590.
Restaurant 2: 320, 410, 360, 410, 380, 370, 290, 310, 320, 230.
mean:
The mean is the average of a set of numbers.
Restaurant 1: 550 + 520 + 610 + 600 + 540 + 750 + 250 + 670 + 510 + 590 = \(\frac{5590}{10}\)
mean = 559
Restaurant 2: 320 + 410 + 360 + 410 + 380 + 370 + 290 + 310 + 320 + 230 = \(\frac{3400}{10}\) = 340
median :
The median is the middle number of a set of numbers that is ordered from least to greatest.
When there is an even amount of numbers, take the average of middle numbers as the median.
Arrange the numbers from least to greatest to find median.
Restaurant 1: 250, 510, 520, 540, 550, 590, 600, 610, 670, 750 = \(\frac{550 + 590}{2}\)
= \(\frac{1140}{2}\) = 570
Restaurant 2: 230, 290, 310, 320, 320, 360, 370, 380, 410, 410 = \(\frac{320 + 360}{2}\)
= \(\frac{680}{2}\) = 340
mode:
The mode is the number that appears most often in a set of numbers.
Arrange the numbers from least to greatest to find mode.
Restaurant 1: 250, 510, 520, 540, 550, 590, 600, 610, 670, 750 = no mode.(as there is no reptation of numbers)
Restaurant 2: 230, 290, 310, 320, 320, 360, 370, 380, 410, 410 = 320 and 410
range :
The range is the difference between the greatest and least numbers in the set.
Arrange the numbers from least to greatest to find range.
Restaurant 1: 250, 510, 520, 540, 550, 590, 600, 610, 670, 750 = 750 – 250 = 500
Restaurant 2: 230, 290, 310, 320, 320, 360, 370, 380, 410, 410 = 410 – 230 = 180
Therefore final conclusion drawn from the data sets of the two restaurants,
restaurant 2 is generally healthier than restaurant 1.
Question 2.
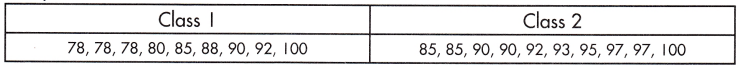
Compare the scores of two different science classes on the same science test.
Answer:
The range of store is smaller in class 2 than it is in class one.
The mean score in class 2 is about 7 points higher than the mean score in class one.
The inference is that the students in class 2 were better prepared for the test.
Explanation:
Given set of date,
Class 1: 78, 78, 78, 80, 85, 88, 90, 92, 100
Class 2: 85, 85, 90, 90, 92, 93, 95, 97, 97, 100
mean:
The mean is the average of a set of numbers.
Class 1: 78 + 78 + 78 + 80 + 85 + 88 + 90 + 92 + 100 = \(\frac{769}{9}\) = 85.44
Class 2: 85 + 85 + 90 + 90 + 92 + 93 + 95 + 97 + 97 + 100 = \(\frac{924}{10}\) = 92.4
median :
The median is the middle number of a set of numbers that is ordered from least to greatest.
When there is an even amount of numbers, take the average of middle numbers as the median.
Arrange the numbers from least to greatest to find median.
Class 1: 78, 78, 78, 80, 85, 88, 90, 92, 100 = 85
Class 2: 85, 85, 90, 90, 92, 93, 95, 97, 97, 100 = \(\frac{92 + 93}{2}\) = \(\frac{185}{2}\) = 92.5
mode:
The mode is the number that appears most often in a set of numbers.
Arrange the numbers from least to greatest to find mode.
Class 1: 78, 78, 78, 80, 85, 88, 90, 92, 100 = 78
Class 2: 85, 85, 90, 90, 92, 93, 95, 97, 97, 100 = 97
Range:
The range is the difference between the greatest and least numbers in the set.
Arrange the numbers from least to greatest to find range.
Class 1: 78, 78, 78, 80, 85, 88, 90, 92, 100 = 100 – 78 = 22
Class 2: 85, 85, 90, 90, 92, 93, 95, 97, 97, 100 = 100 – 85 = 15
Therefore final inference is that the students in class 2 were better prepared for the test.
Question 3.
Compare the prices of 10 different items at a clothing store.

Answer:
The range is higher by $1 for store 1, the mean is about $1 lower.
The inference is that both the stores offer clothes of similar values.
Explanation:
Given set of date,
Store 1: $10, $43, $6, $15, $20, $48, $68, $99, $47, $28
Store 2: $12, $46, $8, $17, $19, $45, $68, $100, $48, $30
mean:
The mean is the average of a set of numbers.
Store 1: $10 + $43 + $6 + $15 + $20 + $48 + $68 + $99 + $47 + $28 = \(\frac{384}{10}\) = 38.4
Store 2: $12 + $46 + $8 + $17 + $19 + $45 + $68 + $100 + $48 + $30 = \(\frac{393}{9}\) = 39.3
median :
The median is the middle number of a set of numbers that is ordered from least to greatest.
When there is an even amount of numbers, take the average of middle numbers as the median.
Arrange the numbers from least to greatest to find median.
Store 1: $6, $10, $15, $20, $28, $43, $47, $48, $68, $99 = \(\frac{28 + 43}{2}\) = 71/2 = 35.5
Store 2: $8, $12, $17, $19, $30, $45, $46, $48, $68, $100 = \(\frac{30 + 45}{2}\) = 75/2 = 37.5
mode:
The mode is the number that appears most often in a set of numbers.
Arrange the numbers from least to greatest to find mode.
Store 1: $6, $10, $15, $20, $28, $43, $47, $48, $68, $99
Store 2: $8, $12, $17, $19, $30, $45, $46, $48, $68, $100
In both the stores there is no mode, as there is no repetition of numbers.
Range:
The range is the difference between the greatest and least numbers in the set.
Arrange the numbers from least to greatest to find range.
Store 1: $6, $10, $15, $20, $28, $43, $47, $48, $68, $99 = 99 – 6 = 93
Store 2: $8, $12, $17, $19, $30, $45, $46, $48, $68, $100 = 100 – 8 = 92
Therefore final inference is that both the stores offer clothes of similar values.
Examine the distributions and measures of center of the data sets below. Then, write 2 to 3 sentences that compare the sets. Make an inference based on the data.
Question 1.
Compare the word counts of 10 different pages from novels read in 5th grade and 8th grade.

Answer:
The range for the number of words is a sample of 8th grade pages is larger than the range of the number of words in the sample of 5th grade pages.
We observe that there is 20 word difference between their means.
So, there is little difference between the number of words on a page between 5th and 8th grade books.
Explanation:
Given set of data,
5th grade word count: 255, 255, 260, 187, 260, 253, 252, 270, 255, 232
8th grade word count: 273, 275, 310, 255, 180, 265, 271, 273, 280, 305
mean:
The mean is the average of a set of numbers.
5th grade word count: 255+255+260+187+260+253+252+270+255+232 = \(\frac{2479}{10}\) = 247.9
8th grade word count: 273+275+310+255+180+265+271+273+280+305 = \(\frac{2687}{10}\) = 268.7
median :
The median is the middle number of a set of numbers that is ordered from least to greatest.
When there is an even amount of numbers, take the average of middle numbers as the median.
Arrange the numbers from least to greatest to find median.
5th grade word count: 187, 232, 252, 253, 255, 255, 255, 260, 260, 270 = \(\frac{255 + 255}{2}\)
= \(\frac{510}{2}\) = 255
8th grade word count: 180, 255, 265, 271, 273, 273, 275, 280, 305, 310 = \(\frac{273 + 273}{2}\)
= \(\frac{546}{2}\) = 273
mode:
The mode is the number that appears most often in a set of numbers.
Arrange the numbers from least to greatest to find mode.
5th grade word count: 187, 232, 252, 253, 255, 255, 255, 260, 260, 270 = 255
8th grade word count: 180, 255, 265, 271, 273, 273, 275, 280, 305, 310 = 273
Range:
The range is the difference between the greatest and least numbers in the set.
Arrange the numbers from least to greatest to find range.
5th grade word count: 187, 232, 252, 253, 255, 255, 255, 260, 260, 270 = 270 – 187 = 83
8th grade word count: 180, 255, 265, 271, 273, 273, 275, 280, 305, 310 = 310 – 180 = 130
So, there is little difference between the number of words on a page between 5th and 8th grade books.
Question 2.
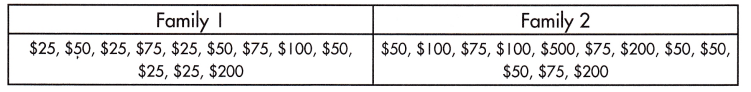
Compare the amounts of money two families donate to charity over 1 year.
Answer:
The range of scores is larger for family 2 than for family 1.
The mean donation of family 2 is about double the mean donation from family 1.
We observe that family 2 consistently donated more money to charity than family 1.
Explanation:
Given set of data,
Family 1: $25, $50, $25, $75, $25, $50, $75, $100, $50, $25, $25, $200
Family 2: $50, $100, $75, $100, $500, $75, $200, $50, $50, $50, $75, $200
mean:
The mean is the average of a set of numbers.
Family 1: $25+$50+$25+$75+$25+$50+$75+$100+$50+$25+$25+$200 = \(\frac{725}{12}\) = 60.41
Family 2: $50+$100+$75 +$100+$500+$75+$200+$50+$50+$50+$75+$200 = \(\frac{1525}{12}\) = 127.08
median :
The median is the middle number of a set of numbers that is ordered from least to greatest.
When there is an even amount of numbers, take the average of middle numbers as the median.
Arrange the numbers from least to greatest to find median.
Family 1: $25, $25, $25, $25, $25, $50, $50, $50, $75, $75, $100, $200 = \(\frac{$50 + $50}{2}\) = \(\frac{$100}{2}\) = $50
Family 2: $50, $50, $50, $50, $75, $75, $75, $100, $100, $200, $200, $500 = \(\frac{$75 + $75}{2}\) =
\(\frac{$150}{2}\) = $75
mode:
The mode is the number that appears most often in a set of numbers.
Arrange the numbers from least to greatest to find mode.
Family 1: $25, $25, $25, $25, $25, $50, $50, $50, $75, $75, $100, $200 = $25
Family 2: $50, $50, $50, $50, $75, $75, $75, $100, $100, $200, $200, $500 = $50
Range:
The range is the difference between the greatest and least numbers in the set.
Arrange the numbers from least to greatest to find range.
Family 1: $25, $25, $25, $25, $25, $50, $50, $50, $75, $75, $100, $200 = $200 – $25 = $175
Family 2: $50, $50, $50, $50, $75, $75, $75, $100, $100, $200, $200, $500 = $500 – $50 = $450
Therefore, we observe that family 2 consistently donated more money to charity than family 1.
Question 3.
Compare family sizes in New York City and the United States.

Answer:
Both data sets have a small range.
When we look at the distribution on small scale,
family size in New York city leans heavily toward small families,
while family size through the United States is more evenly spread across the scale.
Explanation:
Given set of data,
Family size in New York City: 1, 2, 3, 1, 1, 3, 2, 1, 4, 2
Family size in United States: 2, 3, 1, 5, 4, 3, 4, 2, 6, 4
mean:
The mean is the average of a set of numbers.
Family size in New York City: 1 + 2 + 3 + 1 + 1 + 3 + 2 + 1 + 4 + 2 = \(\frac{20}{10}\) = 2
Family size in United States: 2 + 3 + 1 + 5 + 4 + 3 + 4 + 2 + 6 + 4 = \(\frac{29}{10}\) = 2.9
median :
The median is the middle number of a set of numbers that is ordered from least to greatest.
When there is an even amount of numbers, take the average of middle numbers as the median.
Arrange the numbers from least to greatest to find median.
Family size in New York City: 1, 1, 1, 1, 2, 2, 2, 3, 3, 4 = \(\frac{2+2}{2}\) = \(\frac{4}{2}\) = 2
Family size in United States: 1, 2, 2, 3, 3, 4, 4, 4, 5, 6 = \(\frac{3+4}{2}\) = \(\frac{7}{2}\) = 3.5
mode:
The mode is the number that appears most often in a set of numbers.
Arrange the numbers from least to greatest to find mode.
Family size in New York City: 1, 1, 1, 1, 2, 2, 2, 3, 3, 4 = 1
Family size in United States: 1, 2, 2, 3, 3, 4, 4, 4, 5, 6 = 4
Range:
The range is the difference between the greatest and least numbers in the set.
Arrange the numbers from least to greatest to find range.
Family size in New York City: 1, 1, 1, 1, 2, 2, 2, 3, 3, 4 = 4 – 1 = 3
Family size in United States: 1, 2, 2, 3, 3, 4, 4, 4, 5, 6 = 6 – 1 = 5
Question 4.
Compare the number of books read over the summer in two different 7th grade homeroom classes.

Answer:
The mean of the Homeroom A is 6 books and the mean of the Homeroom B is 7 books.
Therefore, Homeroom B read on average of more books than Homeroom A.
Explanation:
Given set of data,
Homeroom A: 5, 9, 10, 15, 4, 3, 0, 9, 6, 7, 1, 2, 5, 10
Homeroom B: 6, 5, 7, 4, 8, 9, 9, 5, 10, 12, 15, 3, 0, 6
mean:
The mean is the average of a set of numbers.
Homeroom A: 5 + 9 + 10 + 15 + 4 + 3 + 0 + 9 + 6 + 7 + 1 + 2 + 5 + 10 = \(\frac{86}{14}\) = 6.14
Homeroom B: 6 + 5 + 7 + 4 + 8 + 9 + 9 + 5 + 10 + 12 + 15 + 3 + 0 + 6 = \(\frac{99}{14}\) = 7.07
median :
The median is the middle number of a set of numbers that is ordered from least to greatest.
When there is an even amount of numbers, take the average of middle numbers as the median.
Arrange the numbers from least to greatest to find median.
Homeroom A: 0, 1, 2, 3, 4, 5, 5, 6, 7, 9, 9, 10, 10, 15 = \(\frac{5+6}{2}\) = \(\frac{11}{2}\) = 5.5
Homeroom B: 0, 3, 4, 5, 5, 6, 6, 7, 8, 9, 9, 10, 12, 15 = \(\frac{6+7}{2}\) = \(\frac{13}{2}\) = 6.5
mode:
The mode is the number that appears most often in a set of numbers.
Arrange the numbers from least to greatest to find mode.
Homeroom A: 0, 1, 2, 3, 4, 5, 5, 6, 7, 9, 9, 10, 10, 15 = 5, 9, 10
Homeroom B: 0, 3, 4, 5, 5, 6, 6, 7, 8, 9, 9, 10, 12, 15 = 5, 6, 9
Range:
The range is the difference between the greatest and least numbers in the set.
Arrange the numbers from least to greatest to find range.
Homeroom A: 0, 1, 2, 3, 4, 5, 5, 6, 7, 9, 9, 10, 10, 15 = 15 – 0 = 15
Homeroom B: 0, 3, 4, 5, 5, 6, 6, 7, 8, 9, 9, 10, 12, 15 = 15 – 0 = 15
Therefore, Homeroom B read on average of more books than Homeroom A.
Question 5.
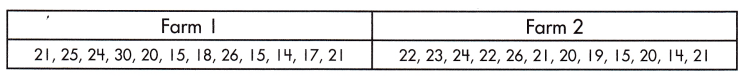
Compare the amounts of eggs each farm collected over 1 year.
Answer:
Both forms average of the same amount of eggs over the course of the entire year.
Explanation:
Given set of data,
Farm1: 21, 25, 24, 30, 20, 15, 18, 26, 15, 14, 17, 21
Farm 2: 22, 23, 24, 22, 26, 21, 20, 19, 15, 20, 14, 21
mean:
The mean is the average of a set of numbers.
Farm1: 21 + 25 + 24 + 30 + 20 + 15 + 18 + 26 + 15 + 14 + 17 + 21 = \(\frac{246}{12}\) = 20.5
Farm 2: 22 + 23 + 24 + 22 + 26 + 21 + 20 + 19 + 15 + 20 + 14 + 21 = \(\frac{247}{12}\) = 20.58
median :
The median is the middle number of a set of numbers that is ordered from least to greatest.
When there is an even amount of numbers, take the average of middle numbers as the median.
Arrange the numbers from least to greatest to find median.
Farm1: 14, 15, 15, 17, 18, 20, 21, 21, 24, 25, 26, 30 = \(\frac{20+21}{2}\)=\(\frac{41}{2}\) = 20.5
Farm 2: 14, 15, 19, 20, 20, 21, 21, 22, 22, 23, 24, 26 = \(\frac{21+21}{2}\)=\(\frac{42}{2}\) = 21
mode:
The mode is the number that appears most often in a set of numbers.
Arrange the numbers from least to greatest to find mode.
Farm1: 14, 15, 15, 17, 18, 20, 21, 21, 24, 25, 26, 30 = 15, 21
Farm 2: 14, 15, 19, 20, 20, 21, 21, 22, 22, 23, 24, 26 = 20, 21, 22
Range:
The range is the difference between the greatest and least numbers in the set.
Arrange the numbers from least to greatest to find range.
Farm1: 14, 15, 15, 17, 18, 20, 21, 21, 24, 25, 26, 30 = 30 – 14 = 16
Farm 2: 14, 15, 19, 20, 20, 21, 21, 22, 22, 23, 24, 26 = 26 – 14 = 12
We conclude that, both forms have average of the same amount of eggs over the course of the entire year.