All the solutions provided in McGraw Hill My Math Grade 5 Answer Key PDF Chapter 11 Lesson 8 Display Measurement Data on a Line Plot will give you a clear idea of the concepts.
McGraw-Hill My Math Grade 5 Answer Key Chapter 11 Lesson 8 Display Measurement Data on a Line Plot
Math in My World
Example 1
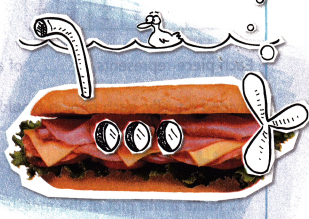
Six friends shared several foot-long submarine sandwiches. The table shows the amount each friend ate. Make a line plot of the lengths in the table.
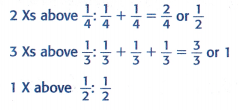
1. Count the number of times each fraction appears in the table.
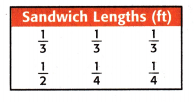
\(\frac{1}{4}\) appears ______________ times.
\(\frac{1}{3}\) appears ______________ times.
\(\frac{1}{2}\) appears ______________ time.
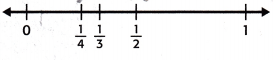
2. Place the correct number of Xs above each fraction on the number line.
3. Add a title to the line plot.
Answer:
Step 1:
Counting the number of times the fraction appears.
\(\frac{1}{4}\) appears 2 times.
\(\frac{1}{3}\) appears 3 times.
\(\frac{1}{2}\) appears 1 time.
Step 2:
Plotting the number line:
A Line plot can be defined as a graph that displays data as points or checks marks above a number line, showing the frequency of each value.
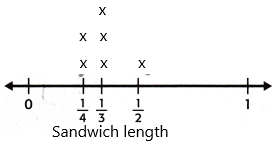
Step 3:
The title of the line plot is Sandwich length which is represented above.
Example 2
Find the fair share using the line plot from Example 1.
1. Add the fractions to find the total amount of sandwiches eaten. Add the fractions with like denominators first.
So, \(\frac{1}{2}\) + 1 + \(\frac{1}{2}\) or ____________ whole sandwiches were eaten.
2. Divide the total amount by the number of Xs on the line plot. To find 2 ÷ 6, you can draw a model.
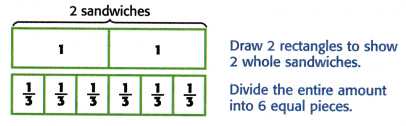
Each piece represents ________________ of a sandwich. So, if the sandwiches were divided equally, each person would have eaten ________________ of a sandwich.
Answer:
Step 1: Added the fractions to find fair.
1/2 + 1 + 1/2
now simplify the equation
2/2 + 1 = 1 + 1 = 2
Therefore, \(\frac{1}{2}\) + 1 + \(\frac{1}{2}\) or 2 whole sandwiches are eaten.
Step 2:
From the above-given diagram, we can say
Each piece represents 1/3 of a sandwich. So, if the sandwiches were divided equally, each person would have eaten 1/3 of a sandwich.
Guided Practice
Question 1.
Make a line plot of the measurements in each table. Then find the fair share.
fair share: ___________
Answer:
Step 1:
Count the number of times the fraction appears.
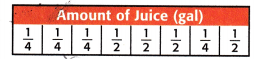
\(\frac{1}{4}\) appears 4 times.
\(\frac{1}{2}\) appears 4 times.
Step 2:
Plotting the number line:
A Line plot can be defined as a graph that displays data as points or checks marks above a number line, showing the frequency of each value.
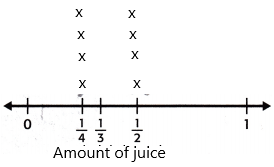
Step 3: The tile of the line plot is the amount of juice.
Now find the fair using the line plot.
Step 4: Add the fractions to find the total amount of juice. Add the fractions.
4 Xs above 1/4: 1/4 + 1/4 + 1/4 + 1/4 = 4/4 = 1
2 Xs above 1/2: 1/2 + 1/2 + 1/2 + 1/2 = 4/2 = 2
So, \(\frac{1}{4}\) + \(\frac{1}{2}\) or 3 gallons of juice.
Step 5: The fair share is 3/8 gallons.
Talk Math
Describe a situation in everyday life in which you would want to find a fair share.

Answer: playing fair includes playing by the rules, taking turns, sharing and listening to others. Additional examples include being open-minded and allowing everyone an equal opportunity to succeed. Fairness builds personal character and promotes honesty and respect for others.
Independent Practice
Make a line plot of the measurements in each table. Then find the fair share.
Question 2.
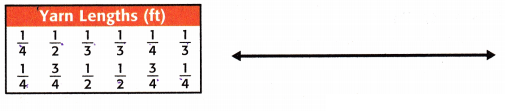
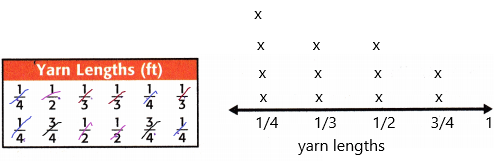
Yarn Lengths (ft)
fair share: _______________
Answer:
Step 1:
Count the number of times the fraction appears.
\(\frac{1}{4}\) appears 4 times.
\(\frac{1}{2}\) appears 3 times.
\(\frac{1}{3}\) appears 3 times.
\(\frac{3}{4}\) appears 2 times.
Step 2:
Plotting the number line:
A Line plot can be defined as a graph that displays data as points or checks marks above a number line, showing the frequency of each value.
The total frequency is 12.
Now find the fair share:
Step 4: Add the fractions to find the total amount of yarn length. Add the fractions.
4 Xs above 1/4: 1/4 + 1/4 + 1/4 + 1/4 = 4/4 = 1
3 Xs above 1/2: 1/2 + 1/2 + 1/2 = 3/2
3 Xs above 1/3: 1/3 + 1/3 + 1/3 = 3/3 = 1
2 Xs above 3/4: 3/4 + 3/4 = 6/4 = 3/2
Now add all the fractions: 1 + 1 + 3/2 + 3/2
: 2 + 6/2
: 4 + 6 / 2
: 10 / 2
: 5
Step 5: The fair share is 5/12 feet.
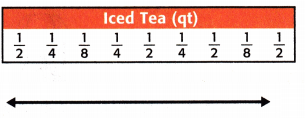
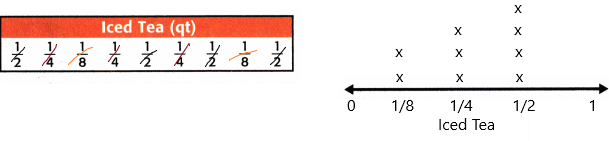
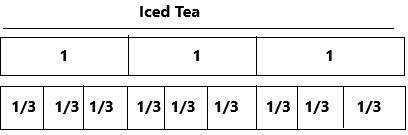
Question 3.
fair share: _______________
Answer:
Step 1:
Count the number of times the fraction appears.
\(\frac{1}{4}\) appears 3 times.
\(\frac{1}{2}\) appears 4 times.
\(\frac{1}{8}\) appears 2 times.
Step 2:
Plotting the number line:
A Line plot can be defined as a graph that displays data as points or checks marks above a number line, showing the frequency of each value.
The total frequency is 9
Now find the fair share:
Step 4: Add the fractions to find the total amount of Iced Tea. Add the fractions.
3 Xs above 1/4: 1/4 + 1/4 + 1/4 = 3/4
4 Xs above 1/2: 1/2 + 1/2 + 1/2 + 1/2 = 4/2 = 2
2 Xs above 1/8: 1/8 + 1/8 = 2/8 = 1/4
Now add all the fractions: 3/4 + 2 + 1/4
: 2 + 4/4
: 2 + 1
: 3
Step 5: The fair share is 3/9 = 1/3 quarts.
Question 4.
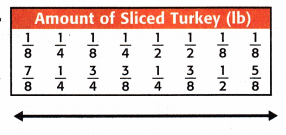
fair share: _______________
Answer:
Step 1:
Count the number of times the fraction appears.
\(\frac{1}{4}\) appears 4 times.
\(\frac{1}{2}\) appears 3 times.
\(\frac{1}{8}\) appears 4 times.
\(\frac{3}{8}\) appears 2 times.
\(\frac{5}{8}\) appears 1 time.
\(\frac{3}{4}\) appears 1 time.
\(\frac{7}{8}\) appears 1 time.
Step 2:
Plotting the number line:
A Line plot can be defined as a graph that displays data as points or checks marks above a number line, showing the frequency of each value.
The total frequency is 16
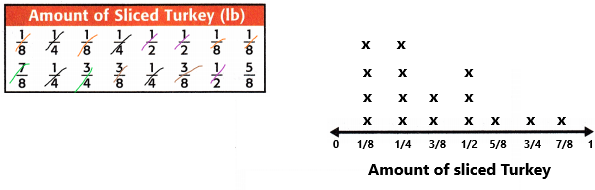
Now find the fair share:
Step 4: Add the fractions to find the total amount of sliced Turkey. Add the fractions with like denominators first.
4 Xs above 1/4: 1/4 + 1/4 + 1/4 + 1/4 = 4/4 = 1
3 Xs above 1/2: 1/2 + 1/2 + 1/2 = 3/2
4 Xs above 1/8: 1/8 + 1/8 + 1/8 + 1/8= 4/8 = 1/2
2 Xs above 3/8: 3/8 + 3/8 = 6/8 = 3/4
1 Xs above 5/8: 5/8
1 Xs above 3/4: 3/4
1 Xs above 7/8: 7/8
Now add all the fractions: 1 + 3/2+ 1/2 + 3/4 + 5/8 + 3/4 + 7/8
: 1 + 4/2 + 6/4 + 12/8
: 1 + 2 + 3/2 + 3/2
: 3 + 6/2
: 3 + 3
: 6
Step 5: The fair share is 6/16 = 3/8 pounds.
Question 5.
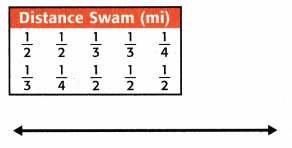
fair share: _______________
Answer:
Count the number of times the fraction appears.
\(\frac{1}{2}\) appears 5 times.
\(\frac{1}{3}\) appears 3 times.
\(\frac{1}{4}\) appears 2 times.
Step 2:
Plotting the number line:
A Line plot can be defined as a graph that displays data as points or checks marks above a number line, showing the frequency of each value.
The total frequency is 10
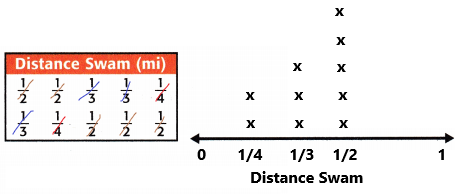
Now find the fair share:
Step 4: Add the fractions to find the total distance. Add the fractions with like denominators first.
2 Xs above 1/4: 1/4 + 1/4 = 2/4 = 1/2
3 Xs above 1/3: 1/3 + 1/3 + 1/3 = 3/3 = 1
5 Xs above 1/2: 1/2 + 1/2 + 1/2 + 1/2 + 1/2= 5/2
Now add all the fractions: 1/2 + 1 + 5/2
: 6/2 + 1
: 3 + 1
: 4
Step 5: The fair share is 4/10 = 2/5 miles.
Problem Solving
For Exercises 6-7, use the line plot that shows the amount of rainfall over a twelve-month period in the city of Middleton.
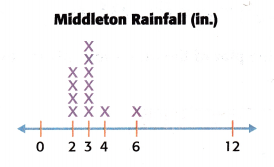
Question 6.
Mathematical PRACTICE Model Math Convert the rainfall amounts to feet and makes a new line plot.
Answer:
1 inch is equal to 1/12 feet:
1″ = 1/12ft = 0.083333ft
The distance d in feet (ft) is equal to the distance d in inches (″) divided by 12:
d(ft) = d(“) / 12
d(ft) = 2/12 = 1/6
d(ft) = 3/12 = 1/4
d(ft) = 4/12 = 1/3
d(ft) = 6/12 = 1/2
d(ft) = 12/12 = 1
Plotting the number line in inches:
A Line plot can be defined as a graph that displays data as points or checks marks above a number line, showing the frequency of each value.
The total frequency is 12
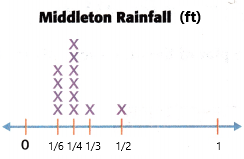
Question 7.
What is the fair share, in feet, if the same amount of rain fell each month?
Answer:
Now find the fair share:
Add the fractions to find the total distance. Add the fractions with like denominators first.
4 Xs above 1/6: 1/6 + 1/6 + 1/6 + 1/6 = 4/6 = 2/3
6 Xs above 1/4: 1/4 + 1/4 + 1/4 + 1/4 + 1/4 + 1/4 = 6/4 = 3/2
1 Xs above 1/3: 1/3
1 Xs above 1/2: 1/2
Now add all the fractions: 2/3 + 3/2 + 1/3 + 1/2
: 3/3 + 4/2
: 1 + 2
: 3
The fair share is 3/12 = 1/4 feet.
HOT Problems
Question 8.
Mathematical PRACTICE Use Number Sense A unit fraction is a fraction with a numerator of 1. What is the greatest unit fraction you can plot on a number line between 0 and 1? Explain.
Answer:
a unit fraction can be defined as a fraction whose numerator is 1. It represents 1 shaded part of all the equal parts of the whole. It is of the form 1/x, where x∈N. A few examples of unit fractions are 1/2, 1/5, 1/34, etc.
The greatest unit fraction you can plot on a number line between 0 and 1 is 1/2.
Question 9.
Building on the Essential Question How can I find the fair share of a set of measurements?
Answer:
You can find the fair share of a set of measurements using a line plot because after you separate them if they’re all even you have a fair share, if they’re not you have to divide those numbers by an equal number that goes into all of them.
McGraw Hill My Math Grade 5 Chapter 11 Lesson 8 My Homework Answer Key
Practice
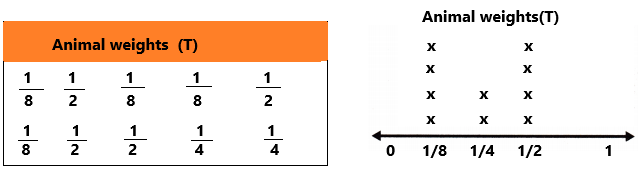
The Zoo list the weights of several animals in the table. Make a line plot of the weights in the table.
1. count the number of times each fraction appears in the table.
1/8 appears 4 times
1/4 appears 2 times
1/2 appears 4 times
2. place the correct number of Xs above each fraction on the number line.
3. Then use the title from the table to add a title to the line plot.
Refer to the Homework Helper to answer Exercises 1 and 2.
Question 1.
Which weight(s) occurred the most often?
Answer:
Now according to the above reference,
the weights that are most occurred is 1/8 T and 1/2 T.
Both are same.
Question 2.
Find the fair share.
Answer:
The total frequency is 10.
Now find the fair share:
Add the fractions to find the total distance. Add the fractions with like denominators first.
4 Xs above 1/8: 1/8 + 1/8 + 1/8 + 1/8 = 4/8 = 1/2
2 Xs above 1/4: 1/4 + 1/4 = 2/4 = 1/2
4 Xs above 1/2: 1/2 + 1/2 + 1/2 + 1/2 = 4/2 = 2
Now add all the fractions: 1/2 + 1/2 + 2
: 2/2 + 2
: 1 + 2
: 3
The fair share is 3/10 tons.
Problem Solving
Question 3.
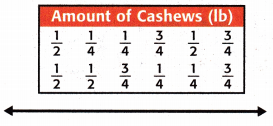
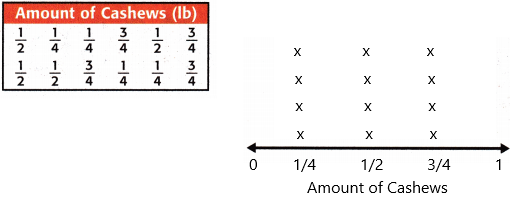
Make a line plot of the measurements in the table.
Answer:
Count the number of times the fraction appears.
\(\frac{1}{2}\) appears 4 times.
\(\frac{3}{4}\) appears 4 times.
\(\frac{1}{4}\) appears 4 times.
Step 2:
Plotting the number line:
A Line plot can be defined as a graph that displays data as points or checks marks above a number line, showing the frequency of each value.
The total frequency is 12
Question 4.
Refer to the table in Exercise 3. What is the fair share, in pounds, of the cashews?
Answer:
Now find the fair share:
Add the fractions to find the whole cashews. Add the fractions with like denominators first.
4 Xs above 1/4: 1/4 + 1/4 + 1/4 + 1/4 = 4/4 = 1
4 Xs above 3/4: 3/4 + 3/4 + 3/4 + 3/4 = 12/4 = 3
4 Xs above 1/2: 1/2 + 1/2 + 1/2 + 1/2 = 4/2 = 2
Now add all the fractions: 1 + 3 + 2
: 6
Step 5: The fair share is 6/12 = 1/2 pounds.
Question 5.
Mathematical PRACTICE Use Math Tools Explain how you can mentally find the sum of the fractions in Exercise 3 without actually performing the calculations.
Answer:
Well, you just have to understand that the number is divided into denominators so you can add them up in your head. { Add the fractions with like denominators first }.
Vocabulary Check
Question 6.
Fill in the correct circle that corresponds to the best answer. Which of the following could be used to find the amount each person would receive if it was divided equally?
(A) fair share
(B) customary system
(C) length
(D) weight
Answer: Option A is the correct answer.
as totalling all of the data and sharing the total equally, that is dividing the sum of the data values by the number of data values, which leads to the standard definition of mean.
Test Practice
Question 7.
Which is the correct fair share for the measurements shown in the line plot?
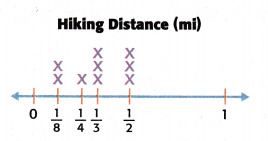
(A) \(\frac{1}{6}\) mile
(B) \(\frac{1}{3}\) mile
(C) \(\frac{1}{2}\) mile
(D) \(\frac{2}{3}\) mile
Answer: Option B is the correct answer.
Now find the fair share:
Add the fractions to find the total distance. Add the fractions with like denominators first.
2 Xs above 1/8: 1/8 + 1/8 = 2/8 = 1/4
1 Xs above 1/4: 1/4
3 Xs above 1/2: 1/2 + 1/2 = 3/2
3 Xs above 1/3: 1/3 + 1/3 + 1/3 = 3/3 = 1
Now add all the fractions: 1/4 + 1/4 + 3/2 + 1
: 2/4 + 3/2 + 1
: 1/2 + 3/2 + 1
: 4/2 + 1
: 2 + 1
: 3
The fair share is 3/9 = 1/3 miles.