All the solutions provided in McGraw Hill My Math Grade 2 Answer Key PDF Chapter 9 Review will give you a clear idea of the concepts.
McGraw-Hill My Math Grade 2 Chapter 9 Review Answer Key
Vocabulary Check
data
survey
tally marks
picture graph
line plot
bar graph
Write the correct word in each blank.
Question 1.
You can collect data by asking people the same question in a ________________.
Answer: survey
Explanation:
You can collect data by asking people the same question in a survey.
Question 2.
A ________________ uses bars to show data.
Answer: bar graph
Explanation:
A graph that uses bars to show data is Bar graph
Question 3.
Numbers or symbols that show information are called ______________.
Answer: data
Explanation:
Numbers or symbols that show information is Data
Question 4.
A ______________ shows how often a certain number occurs in data.
Answer: Line plot
Explanation:
A graph used to show how often a certain number occurs in data is Line plot
Question 5.
A _______________ uses pictures to show information collected.
Answer: picture graph
Explanation:
A graph that has different pictures to show information collected is Picture graph
Question 6.
A _________________ is a mark used to record data collected in a survey.
Answer: tally marks
Explanation:
Marks used in a survey to collect data is Tally marks.
Concept Check
Use the tally chart to make a picture graph.
Question 7.
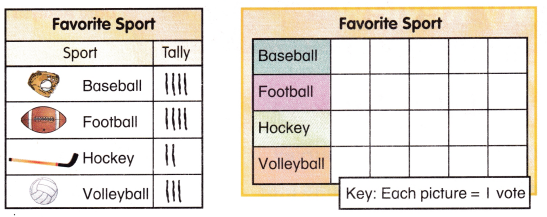
Answer: The detailed votes are given below.
Explanation:
Base ball got 4 votes
Football got 4 votes
Hockey got 2 votes
Volleyball got 3 votes.
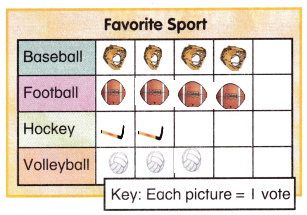
Use the picture graph above to complete the sentences.
Question 8.
How many students were surveyed?
Answer: 13 students got surveyed
Explanation:
Base ball got 4 votes
Football got 4 votes
Hockey got 2 votes
Volleyball got 3 votes.
So, 13 students got surveyed
Question 9.
How many students like hockey and football?
Answer: 5 students like hockey and football
Explanation:
Base ball got 4 votes
Football got 4 votes
Hockey got 2 votes
Volleyball got 3 votes.
So, 5 students like hockey and football.
Use the tally chart to make a bar graph.
Question 10.
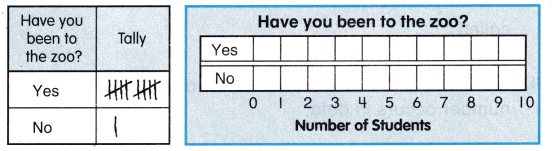
Answer: The bar graph below shows the votes
Explanation:
Yes got 10 votes
No got 1 votes
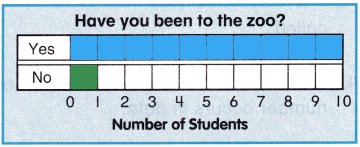
Use the bar graph above to complete the sentences.
Question 11.
How many students have been to the zoo?
Answer: 11 students have been to the zoo
Explanation:
From the bar graph above,
Yes got 10 votes
No got 1 votes
So, 11 students have been to the zoo
Question 12.
How many more students have been to the zoo than have not been to the zoo?
Answer: 10 more students have been to the zoo than have not been to the zoo
Explanation:
From the bar graph above,
Yes got 10 votes
No got 1 votes
So, 10 more students have been to the zoo than have not been to the zoo
Problem Solving
Question 13.
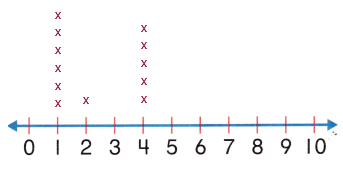
Taylor asked 12 friends to name their favorite number. Five friends said 4. Six friends said I. One friend said 2. Use Taylor’s data to complete the line plot.
Answer: The complete line plot is given below.
Explanation:
Given, Taylor asked 12 friends to name their favorite number.
Five friends said 4. Six friends said I. One friend said 2.
Question 14.
A tricycle has 3 wheels. How many wheels are there on 4 tricycles?
_____________ wheels
Answer: 12 wheels are there on 4 tricycles
Explanation:
Given,
A tricycle has 3 wheels.
For 4 tricycles , 3 × 4 = 12
So, 12 wheels are there on 4 tricycles
Test Practice
Question 15.
There are 4 giraffes at the zoo. Each giraffe has 4 legs. How many legs are there in all?
(A) 2
(B) 4
(C) 8
(D) 16
Answer: D
Explanation:
Given, There are 4 giraffes at the zoo.
Each giraffe has 4 legs.
4 × 4 = 16
So, There are 16 legs in all.
Reflect
Show how to record and analyze data.
Complete the tally chart.
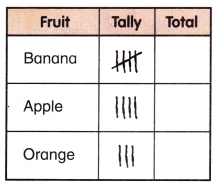
Answer: 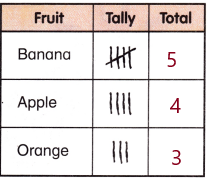
Explanation:
Banana got 5 votes
Apple got 4 votes
Orange got 3 votes.
Use the tally chart to make a picture graph.
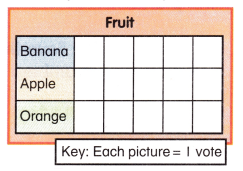
Answer: 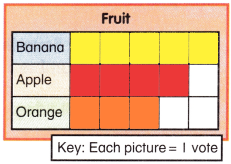
Explanation:
Banana got 5 votes
Apple got 4 votes
Orange got 3 votes.
Use the tally chart to make a bar graph.
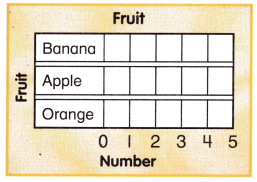
Answer:
Explanation:
Banana got 5 votes
Apple got 4 votes
Orange got 3 votes.
Analyze the data.
How many people like apples and bananas?
Answer: 9 people like apples and bananas
Explanation:
Banana got 5 votes
Apple got 4 votes
Orange got 3 votes.
So, 9 people like apples and bananas.