All the solutions provided in McGraw Hill My Math Grade 2 Answer Key PDF Chapter 9 Check My Progress will give you a clear idea of the concepts.
McGraw-Hill My Math Grade 2 Chapter 9 Check My Progress Answer Key
Check My Progress Page No. (547 – 548)
Vocabulary Check
Write the word to complete each sentence.
picture graph
survey
key
Question 1.
In a ____________, you collect data by asking people the same question.
Answer: Survey
Explanation:
In a Survey you collect data by asking people the same question.
Question 2.
A ________________ tells what (or how many) each symbol stands for.
Answer: Key
Explanation:
A Key tells what (or how many) each symbol stands for.
Question 3.
A ________________ has different pictures to show information collected.
Answer: Picture graph
Explanation:
A Picture graph has different pictures to show information collected.
Concept Check
Ask 10 people their favorite color. Use tally marks to record the data. Use the data in the chart to answer the questions.
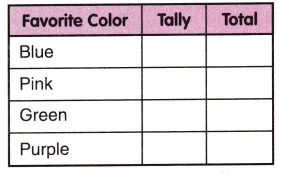
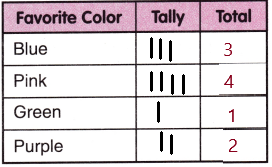
Answer: The recorded tally marks are given below
Explanation:
Question 4.
What color do people like the most?
Answer: Pink
Explanation:
Most of the people liked the color pink.
Question 5.
How many people like pink and green?
Answer: 5 people
Explanation:
5 people liked pink and green.
Question 6.
What color do people like the least?
Answer: Green
Explanation:
The least people liked the color Green.
Use the tally chart to make a picture graph.
Question 7.
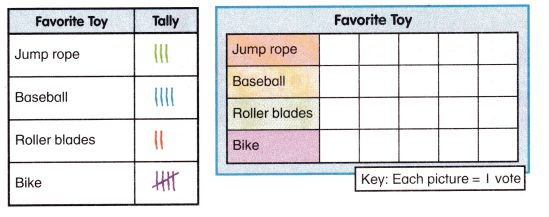
Answer:
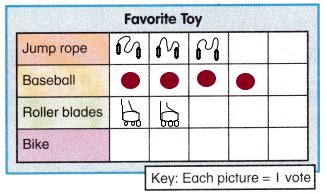
Use the data from the graph to answer the questions.
Question 8.
How many more votes did bike get than baseball?
Answer: Zero
Explanation:
Bike got Zero votes
Question 9.
How many people like jump ropes and roller blades?
Answer: 5 people
Explanation:
5 people like jump ropes and roller blades
Question 10.
How many more people like to bike than jump rope?
Answer: Zero
Explanation:
Bike got Zero votes
Question 11.
How many people like to jump rope and play baseball?
Answer: 7 People
Explanation:
7 people like to jump rope and play baseball.
Test Practice
Question 12.
Two students did not vote. If those 2 students all voted for roller blades, which toy would have the most votes?
(A) Jump rope
(B) Baseball
(C) Roller blades
(D) Bike
Answer: Both B and C
Explanation:
If those 2 students all voted for roller blades
Then roller blades will have a total of 4 votes
And Base ball also has 4 votes
So, Both Base ball and Roller blades have the most votes.